Biociências
Validation of High-Performance Liquid Chromatography for determination and stability assessment of dobutamine hydrochloride in pediatric intravenous therapy
Validação da Cromatografia Líquida de Alta Eficiência para determinação e avaliação de estabilidade do cloridrato de dobutamina na terapia intravenosa pediátrica
Tatiany Calegari¹, Fernando Luis Affonso Fonseca2,3, Beatriz da Costa Aguiar Alves3, Glaucia Luciano da Veiga3, Paulo César Pires Rosa4, Mavilde da Luz Gonçalves Pedreira1, & Maria Angélica Sorgini Peterlini1
1 Escola Paulista de Enfermagem, Universidade Federal de São Paulo (Unifesp) – São Paulo, SP, Brazil; 2 Departamento de Ciências Farmacêuticas, Unifesp – Diadema, SP, Brazil; 3 Laboratório de Análises Clínicas, Centro Universitário Faculdade de Medicina do ABC (FMABC) – Santo André, SP, Brazil; 4 Faculdade de Ciências Farmacêuticas, Universidade Estadual de Campinas (UNICAMP) – Campinas, SP, Brazil.
Como citar: Calegari , T., Fonseca, F., Alves, B., Veiga, G. da, Rosa , P. C., Pedreira, M., & Peterlini, M. A. Validação da Cromatografia Líquida de Alta Eficiência para determinação e avaliação de estabilidade do cloridrato de dobutamina na terapia intravenosa pediátrica. Evidência, 24. https://doi.org/10.18593/evid.34458
Calegari, T.*
https://orcid.org/0000-0001-7917-043X
Fonseca, L. A.
https://orcid.org/0000-0003-1223-1589
Alves, B. da C. A.
https://orcid.org/0000-0001-9930-7747
Veiga, G. L. da
https://orcid.org/0000-0002-6097-2341
Rosa, P. C. P.
https://orcid.org/0000-0003-3665-8878
Pedreira, M. da L. G.
https://orcid.org/0000-0002-9246-2354
Peterlini, M. A. S.
https://orcid.org/0000-0003-1769-4662
*Corresponding author: Rua Napoleão de Barros, 754. Vila Clementino.
04024-002. São Paulo - SP. Phone +55(11) 55764430
Abstract: Severely ill children and newborns typically require a wide range of intravenous medications as part of specific therapies tailored to their developmental and growth characteristics. Intravenous medications for pediatric patients are dosed based on their weight and body surface area, and their response to drug therapy varies with age. Many drugs are originally developed for adults but are prescribed to children based on clinical experience and scientific publications, considering the severity of the condition. In this context, one such medication widely used in pediatric treatment since the 1970s is dobutamine hydrochloride, an inotropic drug with some vasodilatory effect. We aimed to validate High-Performance Liquid Chromatography to determine the concentration and stability of dobutamine hydrochloride. The dobutamine hydrochloride (250mg/ 2mL of water) was used as the sample. The parameters of analytical performance determined were selectivity, linearity, range, precision, accuracy, robustness and stability. The developed method has proved to be selective; linear in the range from 80% to 120% of the theoretical test concentration; precise in repeatability and intermediate precision; exact at the concentrations of 0.40, 0.50 and 0.60 mg/mL; robust with drug variations proportional to the deliberate changes caused in the composition and flow rate of MF, and column temperature; and stable for 24 hours after sample preparation. The High-Performance Liquid Chromatography analytical methodology for dobutamine hydrochloride was considered validated according to Resolution 899/2003 of the Brazilian Health Regulatory Agency (Anvisa).
Resumo: Crianças gravemente doentes e recém-nascidos geralmente necessitam de uma ampla gama de medicamentos intravenosos como parte de terapias específicas adaptadas às suas características de desenvolvimento e crescimento. Os medicamentos intravenosos para pacientes pediátricos são dosados com base em seu peso e área de superfície corporal, e sua resposta à terapia medicamentosa varia com a idade. Muitos medicamentos são originalmente desenvolvidos para adultos, mas são prescritos a crianças com base na experiência clínica e publicações científicas, considerando a gravidade da condição. Nesse contexto, um medicamento amplamente utilizado no tratamento pediátrico desde a década de 1970 é o cloridrato de dobutamina, um medicamento inotrópico com algum efeito vasodilatador. Nosso objetivo foi validar a Cromatografia Líquida de Alta Eficiência para determinar a concentração e estabilidade do cloridrato de dobutamina. O cloridrato de dobutamina (250mg/2mL de água) foi utilizado como amostra. Os parâmetros de desempenho analítico determinados foram seletividade, linearidade, faixa, precisão, exatidão, robustez e estabilidade. O método desenvolvido mostrou-se seletivo; linear na faixa de 80% a 120% da concentração teórica do teste; preciso na repetibilidade e precisão intermediária; exato nas concentrações de 0,40, 0,50 e 0,60 mg/mL; robusto com variações do medicamento proporcionais às alterações deliberadas causadas na composição e taxa de fluxo de MF, e temperatura da coluna; e estável por 24 horas após a preparação da amostra. A metodologia analítica de Cromatografia Líquida de Alta Eficiência para o cloridrato de dobutamina foi considerada validada de acordo com a Resolução 899/2003 da Agência Nacional de Vigilância Sanitária (Anvisa).
Palavras-chave: validação analítica, estabilidade de medicamentos, infusões, intravenoso, Dobutamina.
Introduction
When severely ill, children and newborns (NBs) typically require a wide range of intravenous (IV) medications as part of specific therapies tailored to their developmental and growth characteristics. Due to their organic immaturity and body composition, they have limited tolerance for fluids and exhibit unique characteristics in drug distribution, biotransformation, and excretion (Harada et al., 2012; Ruano et al., 2016; Leopoldino et al., 2018). IV medications for pediatric patients are dosed based on their weight and body surface area, and their response to drug therapy varies with age. Registered Nurses, in most healthcare settings, are responsible for administering and monitoring drug infusions and should possess knowledge about IV drugs and the pharmacokinetics and pharmacodynamics specific to this age group (Pedreira & Chaud, 2004).
Despite the previously mentioned differences, many drugs are originally developed for adults but are prescribed to children based on clinical experience and scientific publications, considering the severity of the condition (Pedreira & Chaud, 2004). In this context, one such medication widely used in pediatric treatment since the 1970s is dobutamine hydrochloride.
Dobutamine hydrochloride (4-[2-[4-(4-hydroxyphenyl)butan-2-ylamino]ethyl]benzene-1,2-diol;hydrochloride), with the molecular formula C18H23NO3·HCl, is a synthetic catecholamine extensively utilized in the treatment of a wide range of shocks and hypoperfusion conditions in children and neonates, particularly when associated with myocardial dysfunction and elevated systemic vascular resistance (Gupta & Donn, 2014; Rios et al., 2014; Bhat & Plakkal, 2015). Classified as a predominantly inotropic drug with some vasodilatory effects, it enhances myocardial contractility, cardiac output, coronary blood flow, and both the supply and consumption of oxygen by the myocardium (Mahoney et al., 2016). Importantly, it lacks endocrine effects and operates independently of the release of endogenous catecholamines (Gupta & Donn, 2014; Rios et al., 2014; Bhat & Plakkal, 2015). Administration is exclusively through continuous infusion, with its effects manifesting within one to two minutes after drug initiation and peaking at 10 minutes. It undergoes rapid hepatic metabolism due to the presence of receptors located in the vascular endothelium and is excreted by the kidneys. The prepared solution should be administered within 24 hours, a timeframe consistent with the drug’s stability, as outlined in its monograph. The pediatric dosing range varies from 2.0 to 20.0 micrograms per kilogram per minute (µg/kg/min), starting with low values and continuous monitoring of heart rate and blood pressure (Kleinman et al., 2010; Taketomo et al., 2011).
Dobutamine hydrochloride can be diluted in various solutions, including 0.9% sodium chloride in water (0.9% NaCl), lactated Ringer’s solution, 5% dextrose in water (D5W), and 10% dextrose in water (D10W) (Micromedex solutions, user guide, 2017). Studies investigating the stability of dobutamine hydrochloride solutions in 0.9% NaCl were conducted in the 1980s and 1990s, yielding results indicating compatibility between the drug and diluent for up to 24 to 48 hours at temperatures of up to 25°C without any loss of content (Horrow et al., 1990; Trissel, 2011). However, there is still a lack of evidence regarding the stability of dobutamine hydrochloride solutions in 0.9% NaCl, which is essential for ensuring the safety of intravenous therapy in neonates and children. One of the techniques employed for analyzing drug stability is High-Performance Liquid Chromatography (HPLC), which quantifies the concentration of the therapeutic agent within the solution. The analytical parameters for separating dobutamine hydrochloride in 0.9% NaCl solution samples are defined in the 32nd revision of the United States Pharmacopeia (USP-32). This method necessitates the preparation of an ion-pair solution using ultrapure water, sodium 1-octanesulfonate, triethylamine, and phosphoric acid (for adjusting the solution’s pH to 2.5). The mobile phase (MP) consists of 58% ionic solution, 28% acetonitrile, and 14% methanol, with a flow rate of 1 milliliter per minute (mL/min). The column temperature is set at 30°C, with an ultraviolet (UV) detector operating at 280 nanometers (nm) and a 20 microliter (μL) sample injection (United States Pharmacopeial Convention [USP], 2009a).
Given the working conditions and available resources, the USP-32 methodology was adapted to enhance the efficiency of dobutamine hydrochloride separation. When applying or modifying an analytical method, a validation study was essential—a process aimed at ensuring the effectiveness of pharmacological analyses and obtaining reliable information about the sample (Ribani et al., 2004; Aragão et al., 2009). Therefore, the objective of this study was to develop and validate an HPLC analytical methodology to accurately determine the concentration and stability of dobutamine hydrochloride.
Material and Methods
This study was conducted to experimentally validate an analytical methodology for the separation of dobutamine hydrochloride. The Brazilian Health Regulatory Agency (Anvisa), in Resolution RE number 899 of 2003, has defined the purpose of validation as demonstrating that the method adheres to analytical principles, ensuring the reliability of the results for its intended use, whether it is for quantitative determination or qualitative analysis of drugs (ANVISA, 2003). The analytical validation strategy and the steps of the analysis were carried out in accordance with Anvisa Resolution RE 899/2003 (International Conference on Harmonization [ICH], 2005), the ICH Q2 (R1) guidelines of the ICH from 200518, and the 32nd revision of the USP (2009b). The analytical performance parameters, determined through experiments, included selectivity, linearity, range, precision, accuracy, and robustness, all of which were appropriate for the analysis.
Reagents, standard and drug
HPLC grade organic solvents were employed, each with a purity of 99.9%: methanol (Merck LiChrosolv®, lot: I811107, expiration date: 12/31/2018) and acetonitrile (Carlo Erba®, lot: D4L065174M, expiration date: 11/3/2017). The reference standard for dobutamine hydrochloride (ABL Antibiotics of Brazil, lot: F446917, expiration date: June 2020, dobutamine content: 100.1% - calculated on an anhydrous basis) was utilized. The drug dobutamine hydrochloride (Dobutrex® - ABL Antibiotics of Brazil, 250 mg/20mL solution, lot: 105921C, expiration date: February 2017) served as the sample/ template.
Chromatographic conditions
The chromatographic analyses were conducted in isocratic mode using the High-Performance Liquid Chromatography system (HPLC Modular Agilent Technologies® 1260 Infinity Series HPLC) with C18 reverse-phase analytical columns measuring 4.6 x 250 mm, containing 5 μm particles (Waters® - Spherisorb ODS 2 Hypersil and Thermo Scientific® - ODS Hypersil). The column temperature was maintained at 30°C, and a UV-Visible detector with a wavelength of 280 nm was utilized.
The composition of the mobile phase (MF) for dobutamine hydrochloride was modified compared to the USP-32 method, consisting of a mixture of methanol (12%), acetonitrile (13%), and an ion-pair solution (75%). The flow rate was kept constant at 1 mL/min, with an injection volume of 20 μL, resulting in an analytical run time of 15 minutes.
A daily cleaning protocol was established for the analytical column using a solution made from methanol and ultrapure water in a 70:30 (v/v) ratio for 20 minutes, with a flow rate set at 1 mL/min in the HPLC. Subsequently, the column was stabilized for 30 minutes using a MF flow program like the cleaning process before commencing the analysis of the standard. At the end of each day of experiments, the cleaning procedure was repeated with the same parameters described above, and the equipment was powered off.
For the preparation of the ion-pair solution, approximately 1.2 grams (g) of 1-hexanesulfonic acid sodium salt monohydrate (C6H13NaO3S.H2O) (Vetec®, lot: DCBCA8821V, expiration date: 01/12/2020) were weighed using an analytical balance (SHIMADZU® - AUY220) on weighing paper. The mass was then transferred to a glass beaker containing 1000 mL of ultrapure water (Milli-Q® Direct - Merck Millipore® ultrapure water purification system), precisely measured using a graduated test tube. The solution was homogenized using a magnetic stirrer (Warmnest® CJ-882A) with a Teflon-coated smooth magnetic bar. The initially basic solution was adjusted to a pH of 2.5 by adding drops of 85.0% P.A.A.S. phosphoric acid (Synth®, lot: 196401, expiration date: 10/03/2020), and the pH verification was performed using a digital benchtop pH Meter (Kasvi® K39-2014B).
After pH correction, the stirrer was switched off, and both the pH sensor and the magnetic bar were removed from the Becker. The solution was then filtered using the Kitassato system connected to the vacuum pump (Prismatec® ١٢١ - Type ٢ VC) with a polyvinylidene difluoride (PVDF) membrane featuring ٠.٤٥ μm pores for filtration (Merck Millipore®). The buffer solution was transferred to a colorless borosilicate glass reagent bottle with a 1000 mL capacity and placed in the ultrasonic washer (Ultronique® Eco-sonics) for air removal.
Preparation of standard solution
Approximately 25.0 mg of the reference standard for dobutamine hydrochloride was weighed on weighing paper using an analytical balance and then transferred into a 50.0 mL volumetric flask, which was subsequently diluted with MF (resulting in a concentration equivalent to 0.5 mg of dobutamine per mL). The solution was thoroughly mixed and then transferred into a 3.0 mL syringe equipped with a Nylon filter featuring 0.45 μm pores and a 13 mm diameter. The initial content was filtered and discarded. Subsequently, the filtration process was repeated, and the solution was filtered and transferred into a vial for chromatographic analysis. The dobutamine hydrochloride standard was prepared daily and analyzed in five replicates through automatic injection in the HPLC equipment, following the analysis of the samples.
Sample preparation
The sample preparation involved drawing 2.0 mL of dobutamine hydrochloride directly from the ampoule (250 mg/20 mL, equivalent to 12.5 mg/mL) using a single-channel micropipette within the range of 1000-5000 μL, which corresponds to 25.0 mg of the drug. This was immediately transferred to a 50.0 mL volumetric flask, to which MF was added. The solution was then thoroughly mixed, resulting in a concentration of 0.5 mg of dobutamine per mL (mg/mL). The filtration procedure was carried out in a manner like that employed for the standard, and the filtrate material was transferred to a vial for subsequent HPLC analysis.
The percentage content of dobutamine hydrochloride was calculated using equation 1 as follows: (SpA x mSd x SpDF x pSd x density x correction factor) / (SdA x mSp x SdDF x theoretical amount). In this equation, SpA represents the Sample Area, mSd denotes the mass of the Standard (mg), SpDF stands for Sample Dilution Factor, pSd indicates the purity of the Standard (%), SdA represents the Standard Area, mSp represents the mass of the Sample (mg), and SdDF signifies the Standard Dilution Factor. To enhance precision in quantification and minimize errors arising from weighing and measuring during experiments, a correction factor of 0.8921 was applied. The theoretical amount refers to the concentration of dobutamine hydrochloride in the pharmaceutical presentation, which is 12.5 mg/mL. The relative density of the liquids was determined through an experimental procedure. Initially, dobutamine hydrochloride was weighed on an analytical balance and placed inside a 10.0 mL pycnometer. Subsequently, ultrapure water, considered the standard due to its absolute density at room temperature being approximately 1.0 gram per cubic centimeter (g/cm³), was weighed using the same instrument. Prior to commencing the experiment, the empty pycnometer was weighed to facilitate subsequent calculations. The temperature of the liquids was maintained at 25ºC, as confirmed using an infrared thermometer (Minipa® - MT ٣٢٠). This determination is based on the concept of absolute density, defined as the ratio of an object›s mass to its volume (d = mass/volume or d = m/V). Relative density, on the other hand, is calculated as the ratio between the absolute densities of two substances [d1,2 = (m1 / V1) / (m2 / V2)]. The volume occupied by mass 1 (dobutamine hydrochloride) is the same as that occupied by mass 2 (water); therefore, these values cancel out in Equation 2: d1,2 = (mass of dobutamine - mass of empty pycnometer) / (mass of water - mass of empty pycnometer). The values obtained through weighing were then substituted into Equation 2, resulting in a relative density for dobutamine hydrochloride of 1.0155.
Additionally, another calculation for the content of dobutamine hydrochloride in mg/mL was performed using Equation 3: [(SpA x mSd x SpDF x pSd / 100 x density x correction factor)] / (SdA x SdDF x mSp). Both the percentage content and the mg/mL were calculated for each sample.
Determination of parameters for method validation
The validation of the chromatographic method for analyzing dobutamine hydrochloride concentrations adhered to the recommended guidelines for analytical methods, encompassing aspects such as selectivity, linearity, precision (both within and between days), accuracy, robustness, and stability. These guidelines were outlined in Resolution of Anvisa RE 899/2003 (ANVISA, 2003), the ICH Q2 (R1) guide of the ICH from 2005 (ICH, 2005), and the 32nd revision of the USP (2009b).
Selectivity
To assess selectivity, chromatograms of the mobile phase (MP), which comprises a mixture of organic solvents and an ion-pair solution following the method’s specified ratio, were compared with chromatograms of the reference standard for dobutamine hydrochloride, chromatograms of the pharmaceutical presentation within the ampoule, and chromatograms of the sample’s diluent, consisting of a 0.9% NaCl solution (HalexIstar®).
Linearity
To create the stock solution, 125.0 mg of dobutamine hydrochloride standard was weighed on an analytical balance. This mass was then transferred to a 25.0 mL volumetric flask and dissolved in the mobile phase (MP), resulting in a concentration equivalent to 5.0 mg of dobutamine per mL (Ribani et al., 2004). After thorough homogenization, an analytical curve was generated by preparing diluted solutions. Different aliquots of 0.8, 0.9, 1.0, 1.1, and 1.2 mL were drawn using a single-channel micropipette from the 100-1000 μL range, respectively, achieving concentrations of 0.40, 0.45, 0.50, 0.55, and 0.60 mg/mL. Each aliquot was individually transferred into 10.0 mL volumetric flasks. MP was added to each flask to reach a final volume of 10.0 mL. Subsequently, the solutions were thoroughly mixed, filtered using a nylon filter syringe, and the content was transferred to vials for analysis, with each step being performed in duplicate.
The analytical curve was constructed using the mathematical ratio between the measured signal (analyte peak areas in mAU - milliabsorbance units) and each concentration. This curve was represented by the linear equation y = ax + b, with coefficients a and b determined through experimental measurements using linear regression (Aragão et al., 2009).
Furthermore, the correlation coefficient (r) or coefficient of determination (r2) was calculated, with a minimum acceptable value set at 0.99. A correlation coefficient closer to 1.0 indicates less dispersion within the experimental measurement dataset, thereby providing an assessment of the quality of the obtained curve (Aragão et al., 2009; ANVISA, 2003; De Abreu et al., 2015).
Precision
Precision can be quantified by estimating the relative standard deviation (RSD) or coefficient of variation (CV), with values not exceeding 5%, as shown in Equation 4: RSD (%) = [(absolute standard deviation) / (arithmetic mean of the number of measurements)] x 100. To conduct this assay, the analyst prepared the dobutamine hydrochloride standard at a concentration of 0.5 mg/mL and performed three chromatographic analyses. Subsequently, following the described procedure for sample preparation of dobutamine hydrochloride, the HPLC system was programmed to perform two sequential injections of each sample, resulting in the preparation of six samples.
Intermediate precision assesses the agreement between experiments conducted within the same laboratory but on two different days and by different analysts. It aims to determine the impact of variations within the laboratory on the method’s consistency and is also expressed through the estimation of the RSD.
On the day following the repeatability assessment, the accuracy of the intermediate precision test was evaluated by a second analyst. This involved the preparation of the standard, five injections thereof, preparation of the six samples, and two sequential injections of each. All these steps adhered to the recommendations for conducting analyses in the same laboratory and using the same equipment. For this assay, Fisher’s test was employed to compare two variances, where the variance is represented by the square of the standard deviation. The formula’s denominator incorporates the value of the highest standard deviation. The purpose of the F test is to ascertain whether there is a significant difference between the precisions of the two analysts. If the calculated F value is less than the tabulated value, considering a significance level of alpha = 0.05, it indicates that the analysts have achieved comparable levels of accuracy (Jeffery et al., 1992).
Accuracy
In accordance with Anvisa Resolution RE 899/2003, standard weightings were performed for these nine determinations, covering the linear range of the assay with three concentrations (0.40 mg/mL, 0.50 mg/mL, and 0.60 mg/mL), and each concentration underwent three replicates during the analytical runs (ANVISA, 2003). The diluent used to prepare the concentrations of dobutamine was a 0.9% sodium chloride solution in water (NaCl 0.9%).
For the three replicates of the 0.40 mg/mL (80%) concentration, three separate masses of 10.2 mg each of the standard were individually weighed. The second concentration was 0.50 mg/mL (100%), with three weightings of 12.5 mg for the standard. In the case of the concentration of 0.60 mg/mL (120%), two weightings of 15.2 mg and one of 15.1 mg were performed. Subsequently, each mass was transferred into a 25.0 mL volumetric flask, filled with the diluent, thoroughly mixed, filtered into vials, and programmed in the HPLC for three consecutive analyses.
Using the sample area values obtained from the standards for each concentration in mg/mL, the content was calculated. The accuracy of the standard with respect to recovery was determined by dividing the content in mg/mL (which represents the mean experimentally determined concentration from each analysis) by its corresponding theoretical concentration (0.40 mg/mL corresponds to 80%, 0.50 mg/mL corresponds to 100%, and 0.60 mg/mL corresponds to 120%), and then multiplying this ratio by 100.
Robustness
Initially, the dobutamine hydrochloride sample was prepared within the linear range of 0.5 mg/mL, and the standard was also prepared. Both were analyzed under the method’s original conditions. Subsequently, individual variations were introduced one at a time: the MP flow rate (0.95 mL/min and 1.05 mL/min), the temperature of the analytical column module (27°C and 33°C), and the MP composition (12% methanol with increased acetonitrile to 15% and reduced ion-pair solution to 73%, and 12% methanol with reduced acetonitrile to 12% and increased ion-pair solution to 76%).
For each variation, the standard’s area values were recorded and divided by the corresponding sample area values. The resulting ratio was then multiplied by 100 and divided by the ratio obtained with the previously altered parameter.
Stability
To perform this test, it is advisable to prepare the standard and sample according to the method for initial analyses and at specified time intervals. The initial analysis is designated as time zero, and subsequent analyses are conducted every three hours until a total of 24 hours have elapsed since preparation. Over a 24-hour period, the sample diluted in 0.9% NaCl solution was stored in the refrigerator (2 to 8ºC), exposed to light. The initial analysis is designated as time zero and subsequent analyses are conducted every three hours up to 24 hours resulting in a total of nine analysis for each substance. The sample and standard areas should then be evaluated for relative standard deviation, with a maximum acceptable value of 2% (De Abreu et al., 2015). The stability test was conducted using the commercial sample of dobutamine hydrochloride at a dilution of 0.5 mg/mL.
Results
In the Selectivity assay, the calculated mean of the standard’s five analytical runs was 6899.63. For the dobutamine hydrochloride from the pharmaceutical form in the ampoule, in the initial analytical run, the area was measured at 7728.97, resulting in a content calculation of 12.8420 mg/mL and 102.7356%. In the second analytical run, the drug produced an area of 7745.79, with a calculated content of 12.8699 mg/mL and 102.9592% (Figure 1a). The mean content of mg/mL for the two injections was 12.8559 (± 0.0197). The average percentage content obtained was 102.8474 (± 0.1580), with an RSD of 0.1537 for both. The peak retention time was 9 minutes.
The chromatograms of the diluent (0.9% NaCl) and the mobile phase (MP), both analyzed by HPLC, are presented in Figure 1b. It is evident from these chromatograms that there were no observable interferences from the MP or diluent in the retention time of dobutamine hydrochloride.
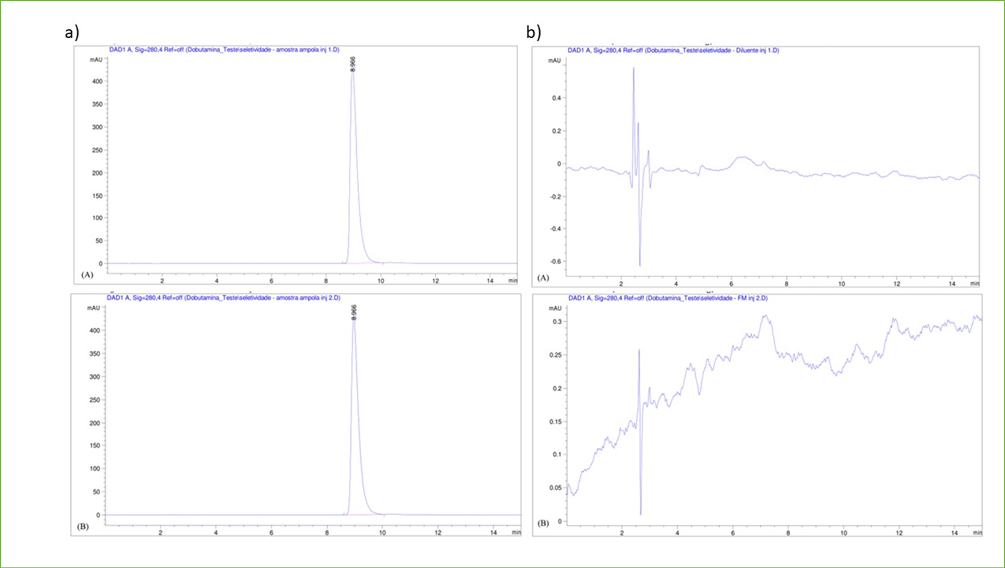
Figure 1. a) First chromatographic separation (A) and second chromatographic separation (B) of the dobutamine hydrochloride sample in the Mobile Phase Selectivity assay in the proportion: 75% ion-pair solution, 13% acetonitrile and 12% methanol; b) Report of the chromatographic analysis of the diluent (A) and the Mobile Phase (B) in the Selectivity assay with the Mobile Phase in the proportion: 75% ion-pair solution, 13% acetonitrile and 12% methanol.
In the Linearity test, the mass of the standard used was 25.2 mg, and the average of the five injection areas of the standard was 7075.54 (±12.66). The five concentrations were each analyzed in duplicate. Initially, the mean area (Table 1) was calculated. Subsequently, the analytical curve of dobutamine hydrochloride was generated (Figure 2), resulting in a correlation coefficient R = 0.99818. Furthermore, within the calibration curve spanning a range from 0.40 to 0.60 mg/mL of dobutamine hydrochloride standard concentration, a correlation coefficient R = 0.99818 was calculated. This value falls within the acceptable range, demonstrating that the method is indeed linear.
Table 1. Areas of analyzes 1 and 2 of the concentrations of the linear range from 80% to 120% of dobutamine hydrochloride.
|
Concentration (mg/mL) |
Analyze Area 1 |
Analyze Area 2 |
Mean Area |
|
0.40 |
5561.73 |
5567.60 |
5564.665 |
|
0.45 |
6211.33 |
6211.30 |
6211.315 |
|
0.50 |
6839.12 |
6839.39 |
6839.255 |
|
0.55 |
7612.40 |
7603.43 |
7607.915 |
|
0.60 |
8164.32 |
8155.75 |
8160.035 |
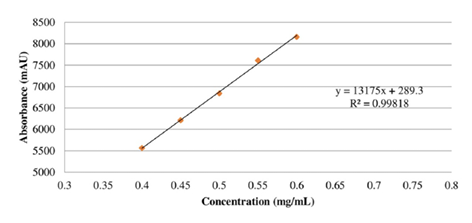
Figure 2. Analytical curve of dobutamine hydrochloride.
The accuracy assay is conducted to assess precision and involved two analysts performing separate tests on different days using six sample preparations of dobutamine hydrochloride, with two injections for each. The data were then utilized to calculate the content in mg/mL and percentage. Table 2 presents the mean area and content values, along with their corresponding mean, standard deviation (SD), and relative standard deviation (RSD), for the samples from the two analysts. Regarding intermediate precision, statistical hypothesis testing methods are employed to ensure that there is no significant statistical difference in the results, often utilizing the F test to compare standard deviations (Kirschenbaum et al., 1982). In this context, since the standard deviation represents variance, and when the Fisher test was applied, the calculated F value was found to be 1.3675, indicating that there is no significant difference. The tabulated F-test value is 5.05, considering 6 samples in each group, 5 degrees of freedom, and a 99% confidence interval. The experimental F-value of 1.3675 indicates that repeatability and intermediate precision do not exhibit statistically significant differences. Results for concentrations of 0.40 mg/mL, 0.50 mg/mL, and 0.60 mg/mL are presented for each theoretical concentration, including the minimum and maximum recovery intervals for each range, along with their respective values, standard deviations, and relative standard deviations (Table 3). As per Anvisa Resolution RE 899/2003, the standard deviation in the Accuracy assay should not exceed 15%, a condition met across all three concentrations studied, thereby ensuring the accuracy of the validation method (USP, 2009b).
Table 2. Repeatability precision performed by analyst 1 and analyst 2.
|
Mean of sample mass |
Mean of sample area |
Mean of concentration (mg/mL) |
Mean of concentration (%) |
|
|
Analyst 1 - day 1 |
||||
|
Sample 1 Sample 2 Sample 3 Sample 4 Sample 5 Sample 6 |
1.9793 1.9852 2.0025 1.9919 1.9940 1.9918 |
7719.77100 7784.13745 7798.60278 7787.78882 7802.60889 7786.47583 |
12.6813 12.7490 12.6623 12.7120 12.7228 12.7105 |
101.4498 101.9917 101.2984 101.6477 101.7825 101.6843 |
|
Mean of repeatability 1 |
12.7063 |
101.6424 |
||
|
Standard deviation (SD) |
0.0307 |
0.2445 |
||
|
Relative standard deviation (RSD) |
0.2415 |
0.2405 |
||
|
Analyst 2 - day 2 |
||||
|
Sample 1 Sample 2 Sample 3 Sample 4 Sample 5 Sample 6 |
1.9960 1.9866 1.9920 1.9966 1.9830 1.9851 |
7782.86011 7727.72193 7769.50171 7774.75171 7728.82568 7785.49243 |
12.5101 12.4803 12.5137 12.4933 12.5047 12.5831 |
100.0807 99.8419 100.1095 99.9464 100.0374 100.6643 |
|
Mean of repeatability 2 |
12.5142 |
100.1134 |
||
|
Standard deviation (SD) |
0.0359 |
0.2870 |
||
|
Relative standard deviation (RSD) |
0.2868 |
0.2867 |
Table 3 Values of theoretical concentration, minimum and maximum recovery interval for each range with values, standard deviation and relative standard deviation
|
Concentration (mg/mL) |
Theoretical Concentration |
Recovery interval (%) (minimum and maximum) |
Standard deviation |
Relative standard deviation (%) |
|
0.4 |
80 |
102.3314−106.0185 |
1.2444 |
1.1888 |
|
0.5 |
100 |
99.5575−104.3670 |
2.2864 |
2.2418 |
|
0.6 |
120 |
97.2378−102.2866 |
2.0942 |
2.0881 |
Another noteworthy aspect of this assay is that the suggested recovery range closely aligns with the final concentration of the active ingredient in the sample, falling within the range of 90% to 110% thereof (Kirschenbaum et al., 1982). This recovery range was indeed observed at the tested concentrations, with values spanning from 97.23% to 106.01%.
In the robustness assay, certain chromatographic conditions, such as the composition and flow rate of MP, in addition to column temperature, were intentionally altered. The values of the standard areas for each variation were divided by the corresponding sample areas, with the resulting ratio multiplied by 100. The variation outcomes are depicted in Figure 3.
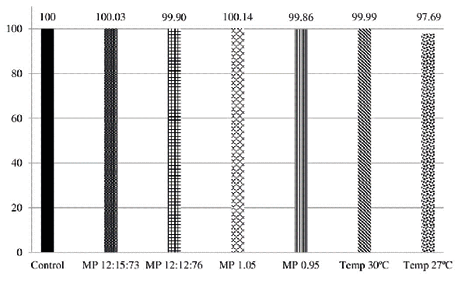
Figure 3. Robustness of the dobutamine hydrochloride method, according to variations in the composition of the Mobile Phase, flow of the Mobile Phase and temperature of the column in relation to the original conditions of analysis. Note: MP – Mobile Phase; Temp – temperature
For the stability assay, the initial sample area value was set as 100. Subsequent area values were divided by the initial value, and the resulting ratio was multiplied by 100 to determine the variation at each analysis moment (ranging from zero to 24 hours). Similar calculations were applied to the standard, and the results are presented in Figure 4. This assay was conducted over a 24-hour period following the preparation of the dobutamine hydrochloride standard and sample, with no significant variations observed during this timeframe.
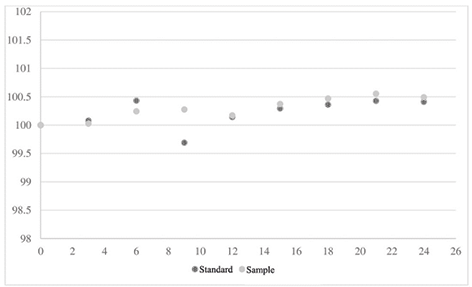
Figure 4. Variation of sample and standard areas from the preparation time to 24 hours after.
Discussion
The validation of the method involves conducting necessary tests to ensure that the analytical procedure is scientifically suitable for routine use under specific applicability conditions. This systematic assessment of the method demonstrates its capability to consistently produce the expected results as per the analytical objectives (De Abreu et al, 2015). In this validation, various tests were conducted, and satisfactory results were achieved in alignment with the fundamental validation criteria for analytical methods, in accordance with Anvisa Resolution RE 899/2003 (ANVISA, 2003), the ICH Q2 (R1) guide from the 2005 ICH (2005) and the 32nd revision of the USP (2009b).
As per Anvisa Resolution RE 899/2003, the method’s capability to accurately analyze a specific compound of interest (referred to as the analyte) is essential, even when the sample contains additional components such as degradation products, impurities, or biological matrices (ANVISA, 2003). Selectivity plays a pivotal role in ensuring that the chromatogram’s peak response solely represents the compound of interest, thereby confirming the analyte’s identity (Ribani et al., 2004). Thus, the Selectivity assay assesses whether the determination of a specific analyte is free from interference by other compounds, such as degradation products, excipients, and impurities. In this context, the chromatograms obtained from the MP, diluent, and dobutamine hydrochloride in the pharmaceutical form were scrutinized to detect any impurity peaks that might appear during the retention time of the target drug (De Abreu et al., 2015). The Selectivity investigation carried out in this study confirmed that the MP, diluent, and drug, when compared to the well-known reference standard of dobutamine hydrochloride, do not contain structurally similar components that could be present during the analyses (ICH, 2005).
As observed in the chromatograms, only the peaks of dobutamine hydrochloride were present, with no detectable peaks of degradation products or impurities in the diluent and MP samples. Consequently, the method is deemed selective.
Linearity is a crucial aspect of the assay, which involves determining whether, within a specified or predetermined concentration range, the analytical methodology can establish that the analysis results are directly proportional to the concentration of the analyte in the sample. In the case of quantitatively determining a substance in pharmaceutical forms, it is essential to conduct analyses at a minimum of five different concentrations spanning from 80% to 120% of the theoretical test concentration (USP, 2009b; De Abreu et al., 2015). Furthermore, linearity is established when the measured signal correlates with each concentration of the analyte of interest, and this linear relationship was confirmed through mathematical linear regression analysis (De Abreu et al., 2015). The obtained correlation coefficient of R = 0.99818 falls within the acceptable range, demonstrating that the method is indeed linear. According to Anvisa Resolution RE number 899 of 2003, the linear correlation coefficient must be equal to or greater than 0.99 (ANVISA, 2003; De Abreu et al., 2015).
Precision is determined by conducting a series of measurements on a uniform sample, using identical and independent assay conditions. The goal is to ensure that the results of these individual analyses are closely clustered together, indicating a high degree of repeatability in the measurements (ANVISA, 2003). Repeatability, on the other hand, is characterized by the consistency of results obtained from successive analyses using the same method, conducted by the same analyst, with the same instrumentation and conditions, all within the same location and typically within a short time frame (usually on the same day). The repeatability of the method is assessed through at least six determinations at 100% of the test concentration, and this can also be expressed by estimating the RSD (Ribani et al., 2004; De Abreu et al., 2015). The precision of the analyzed analytical procedure was determined through the examination of consistent results obtained from homogeneous samples subjected to multiple samplings and a series of measurements (ICH, 2005). Precision tests were conducted through six determinations at 100% of the test concentration and involved two analysts. The precision of the analytical method is expressed in terms of standard deviation (SD) or relative standard deviation (RSD) values, which are derived from a set of measurements. Depending on the applied methodology, its purpose, the type of matrix, and the analyte concentration in the sample, the maximum acceptable deviation is typically less than 5%v (ANVISA, 2003; De Abreu et al., 2015). In accordance with this criterion, the tested method is considered precise, as both analysts obtained results within the permissible range. Accuracy is defined as the degree of similarity between a reference value accepted as true and the results obtained from individual analyses. This was assessed through nine determinations, which consisted of three replicates each for low, medium, and high concentrations (Ribani et al., 2004; ANVISA, 2003; De Abreu et al., 2015). Hence, the accuracy of the analytical procedure is substantiated by the alignment of the found values with the accepted or true reference value (De Abreu et al., 2015).
The determination of robustness assesses the method’s reliability during routine analyses by measuring its ability to withstand small, predetermined changes in analytical parameters. The factors considered for variation include organic solvent concentration, MP flow rate, temperature, MP composition, pH, ionic strength of MP, and different lots or column manufacturers. These variations may reflect potential changes when the method is transferred to different equipment, laboratories, or executed by different analysts (ANVISA, 2003; Ribani et al., 2004). Considering robustness assays, the results of the minor deliberate adjustments made to the analytical parameters during the robustness assay indicate that both the sample and the drug standard vary proportionally with the programmed conditions, without compromising the performance of the analytical methodology. In accordance with the robustness assay’s premise, these slight variations do not impact the analytical procedure, providing an assurance of reliability during the method’s routine application in pharmacological analyses (De Abreu et al., 2015). The altered parameter of column temperature, one of the adjustments made, requires stringent control to maintain the repeatability of retention times in the analyses. Elevated temperatures can potentially degrade the analytical column and reduce retention times by increasing substance diffusion rates (Kirschenbaum et al., 1982).
Stability enables us to determine whether the analyte maintains its chemical stability within specific time intervals and under defined conditions. The assessment is conducted during sample collection and handling, involving short-term storage at room temperature. Additionally, the standard is assessed over a longer duration, extending at least six hours beyond the analytical run’s duration (ANVISA, 2003). In our test, there were no significant variations in the stability of the compound.
To validate a drug using HPLC, it is essential to develop and validate a precise and reliable analytical method. Analytical method validation is a crucial process to ensure the quality and reliability of results obtained during drug analysis. Numerous studies address the development and validation of HPLC methods for a variety of drugs, demonstrating the importance and relevance of this practice. For example, a study by Chintapilli et al. (2018) describes the development and validation of an RP-HPLC method for the estimation of Ado-Trastuzumab Emtansine in a pharmaceutical form. This work underscores the need for reliable analytical methods to ensure the accuracy of drug analyses in pharmaceutical forms. Desai et al. (2012), on their part, discusses the development and validation of an HPLC method for the determination of solifenacin succinate, including the identification of degradation products. Such studies are essential to ensure the stability and safety of drugs over time. De Abreu et al. (2015), discusses the development and validation of an HPLC method for determining methotrexate in pediatric cancer patients. Sivanadh (2016), in turn, also used the HPLC technique to assess the presence of dobutamine in pharmaceutical formulations. Similarly to our study, the author employed a C18 reverse-phase column, 4.6 x 250 mm, at a temperature of 30°C, with a UV-visible detector at 280 nm and a mobile phase mixture of methanol, acetonitrile, and an ionic solution, with a flow rate of 1 mL/min and an injection volume of 20 μL. According to the author, under these technical conditions, HPLC can be successfully used for the quality control of pharmaceutical solutions containing dobutamine.
This study aimed to validate the HPLC methodology in dobutamine solutions adapted for pediatric application; however, the impacts of the neonatal ICU environment—such as temperature and light—on this solution were not evaluated. Further studies addressing this issue must be conducted.
Conclusion
Thus, in terms of the fundamental validation criteria for analytical methods, the results obtained have met the requirements set forth by Anvisa RE number 899 of 2003, the ICH Q2 (R1) guide of the 2005 ICH, and the 32nd revision of the USP. The developed HPLC method for the separation of dobutamine hydrochloride has successfully undergone validation. It has demonstrated selectivity, precision, stability, robustness, accuracy, and linearity within the range of 80% to 120% of the theoretical concentration of the test. Therefore, the proposed method can be deemed suitable for use in the analysis of dobutamine hydrochloride, whether in a 0.9% NaCl solution or in the commercial form of the active pharmaceutical ingredient.
References
Agência Nacional de Vigilância Sanitária. (2003). Resolução RE nº 899, de 29 de maio de 2003. Guia para validação de métodos analíticos e bioanalíticos. http://www.portal.anvisa.gov.br/documents/33880/2568070/RE_899_2003.pdf. Accessed August 15, 2020.
Aragão, N. M., Veloso, M. C., & Andrade, J. B. (2009). Validation of chromatographic methods - an experiment using HPLC and Green Chemistry in methylxanthines determination. Quimica Nova, 32, 2476-2481.
Bhat, B. V., & Plakkal, N. (2015). Management of shock in neonates. Indian Journal of Pediatrics, 82, 923-929.
Chintapilli, A., Satyavathi, K., Bhojaraju, P., Kanthal, L. K., & Manna, S. (2018). Rp-hplc method for estimation of ado-trastuzumabe emtansine injection in pharmaceutical dosage form. Asian Journal of Chemistry, 30(2), 301-304.
De Abreu, L. C. C., Rosa, P. C., Alves, B. C., Azzalis, L. A., Gehrke, F. S., Pereira, E. C., Junqueira, V. B., Perazzo, F. F., & Fonseca, F. F. (2015). Development and validation of HPLC method to determination of Methotrexate in children oncologic patients. European Review for Medical and Pharmacological Sciences, 19, 1373-1380.
Desai, D. S., Patel, G., Shukla, N., & Rajput, S. J. (2012). Development and validation of stability-indicating hplc method for solifenacin succinate: isolation and identification of major base degradation product. Acta Chromatographica, 24(3), 399-418.
Gupta, S., & Donn, S. M. (2014). Neonatal hypotension: dopamine or dobutamine? Seminars in Fetal and Neonatal Medicine, 19, 54-59.
Harada, M. J., Chanes, D. C., Kusahara, D. M., & Pedreira, M. L. (2012). Safety in medication administration in pediatrics. Acta Paulista de Enfermagem, 25, 639-642.
Hisakata, R., Nishida, S., & Johnston, A. (2016). An adaptable metric shapes perceptual space. Current Biology, 26(14), 1911–1915. https://doi.org/10.1016/j.cub.2016.05.047
Horrow, J. C., Digregorio, G. J., Barbieri, E. J., & Rupp, E. (1990). Intravenous infusions of nitroprusside, dobutamine, and nitroglycerin are compatible. Critical Care Medicine, 18, 858-861.
International Conference on Harmonization. (2005). Validation of analytical procedures: text and methodology Q2(R1). ICH Expert Working Group. Geneva. http://www.ich.org/fileadmin/Public_Web_Site/ICH_Products/Guidelines/Quality/Q2_R1/Step4/Q2_R1__Guideline.pdf. Accessed August 15, 2020.
Jeffery, G. H., Bassett, J., Mendham, J., & Denney, R. C. (1992). Vogel Análise Química Quantitativa (15th ed.). LTC, Rio de Janeiro.
Kirschenbaum, H. L., Aronoff, W., Perentesis, G. P., Piltz, G. W., Goldberg, R. J., & Cutie, A. J. (1982). Stability of dobutamine hydrochloride in selected large-volume parenterals. American Journal of Hospital Pharmacy, 39, 1923-1925.
Kleinman, M. E., Chameides, L., Schexnayder, S. M., Samson, R. A., Hazinski, M. F., Atkins, D. L., Berg, M. D., Caen, A. R., Flink, E. L., Freid, E. B., Hickey, R. W., Marino, B. S., Nadkarni, V. M., Proctor, L. T., Qureshi, F. A., Sartorelli, K., Topjian, A., van der Jagt, E. W., & Zaritsky, A. L. (2010). Part 14: Pediatric advanced life support: 2010 American Heart Association Guidelines for Cardiopulmonary Resuscitation and Emergency Cardiovascular Care. Circulation, 122(18 Suppl 3), S876–S908.
Leopoldino, R. W., Costa, H. T., Costa, T. X., Martins, R. R., & Oliveira, A. G. (2018). Potential drug incompatibilities in the neonatal intensive care unit: a network analysis approach. BMC Pharmacology and Toxicology, 19(1), 83.
Mahoney, L., Shah, G., Crook, D., Rojas-Anaya, H., & Rabe, H. (2016). A literature review of the pharmacokinetics and pharmacodynamics of dobutamine in neonates. Pediatric Cardiology, 37, 14-23.
Micromedex. (2017). Dobutamine Hydrochloride. http://www-micromedexsolutions-com.ez69.periodicos.capes.gov.br/micromedex2/librarian/PFDefaultActionId/evidencexpert.DoIntegratedSearch#. Accessed August 15, 2017.
Pedreira, M. L., & Chaud, M. N. (2004). Pediatric intravenous therapy: subsidies for nursing practice. Acta Paulista de Enfermagem, 17, 222-228.
Ribani, M., Bottoli, C. B. G., Collins, C. H., Jardim, I. C. S. F., & Melo, L. F. C. (2004). Validation for chromatographic and electrophoretic methods. Quimica Nova, 27, 771-780.
Rios, D. R., Moffett, B. S., & Kaiser, J. R. (2014). Trends in pharmacotherapy for neonatal hypotension. The Journal of Pediatrics, 165, 697-701.
Ruano, M., Villamañán, E., Pérez, E., Herrero, A., & Álvarez-Sala, R. (2016). New technologies as a strategy to decrease medication errors: how do they affect adults and children differently? World Journal of Pediatrics, 12, 28-34.
Taketomo, C. K., Hodding, J. H., & Kraus, D. M. (2011). Pediatric & Neonatal Dosage Handbook: a comprehensive resource for all clinicians treating pediatric and neonatal patients (18th ed.). Lexi-Comp.
Trissel, L. A. (2011). Handbook on Injectable Drugs (16th ed.). American Society of Health-System Pharmacists.
United States Pharmacopeial Convention. (2009a). Dobutamine Injection. In The United States Pharmacopeia. The National Formulary, USP thirty-second rev., NF, 27th ed. Rockville.
United States Pharmacopeial Convention. (2009b). Validation of compendial procedures. In The United States Pharmacopeia. The National Formulary, USP 32nd rev., NF 27th ed. Rockville.