Inovação
Spatial analysis of soil micronutrients in an area of extensive pasture in the southeast of the State of Tocantins
Análise espacial de micronutrientes do solo em uma área de pastagem extensiva no sudeste do Estado do Tocantins
José Avelino Cardoso1, Luan Ferraz de Queiroz1, Heloisa Donizete da Silva1,
Regina Pereira Lages1, Tamara Thalia Prolo1, Rodrigo José da Silva1, Kaio Cesar Lima Vale1 e Antonio Clementino dos Santos1
1 Programa de Pós-Graduação em Produção Vegeral (PPGPV), Universidade Federal do Tocantins (UFT) – Palmas, TO, Brazil
How to cite:Cardoso , J. A., Queiroz, L. F. de, Silva, H. D. da, Lages, R. P., Prolo, T. T., Silva, R. J. da, Vale, K. C. L., & Santos, A. C. dos. Análise espacial de micronutrientes do solo em uma área de pastagem extensiva no sudeste do Estado do Tocantins. Evidência, 24. https://doi.org/10.18593/evid.32855
Cardoso, J. A.*
jose.cardoso@ifto.edu.br
https://orcid.org/0009-0002-7875-8594
Queiroz, L. F. de
luan.queiroz@mail.uft.edu.br
https://orcid.org/0000-0003-0632-843X
Silva, H. D. da
isadonizette@gmail.com
https://orcid.org/0000-0003-2509-0762
Lages, R. P.
regina.lages12@gmail.com
https://orcid.org/0000-0002-2834-3182
Prolo, T. T.
thaliprolo5@gmail.com
https://orcid.org/0000-0002-8921-3250
Silva, R. J. da
rodrigojdsilva@mail.uft.edu.br
https://orcid.org/0009-0006-7619-8385
Vale, K. C. L.
kaioprofi@gmail.com
https://orcid.org/0000-0003-2446-2181
Santos, A. C. dos
clementino@mail.uft.edu.br
https://orcid.org/0000-0001-7943-7923
* Corresponding author: Rodovia To-040, Km 349, Loteamento Rio Palmeira, Lote 1 0 Zona Rural, Dianópolis - TO, 77300-000
ABSTRACT: The variability of micronutrients in the soil is influenced by geology, biological factors and anthropogenic factors that can affect the lack or excess of these in the soil, which despite being required in smaller quantities are essential for plant development. The aim of this study was to assess the spatial behaviour of micronutrients in an extensive pasture area in the southeast of the state of Tocantins. The experiment was conducted at the Federal Institute of Tocantins, Dianópolis Campus, Animal Production Sector, located in the municipality of Dianópolis (TO). The soil evaluated was classified as dystrophic Haplic Cambisol and has a history of extensive pasture for more than 10 years. Soil samples were collected manually at a number of georeferenced sampling points (25x25m) within the study area (approximately 2 ha), totalling 30 composite samples, at a depth of 0-20 cm. Clay, pH, OM and micronutrient levels were analyzed from each soil sample: boron (B), iron (Fe), copper (Cu), manganese (Mn) and zinc (Zn), and the data was subjected to analysis geospatial by software Surfer. The variability of the attributes classified according to their coefficient of variation (CV) showed high values (CV>60%) for Fe, Mn and Zn, medium values (15-60%) for Clay, OM, B and Cu and low values (<15%) for pH. Therefore, the attributes researched presented a low to high degree of spatial dependence. However, it was possible to map the chemical attributes of the soil, where the greatest variability was observed for the micronutrients Zn, Mn and Fe.
Keywords: Variability, Nutrients, Soil.
RESUMO: A variabilidade dos micronutrientes no solo é influenciada pela geologia, fatores biológicos e fatores antropogênicos que podem afetar a falta ou excesso destes no solo, que apesar de serem requeridos em menores quantidades são essenciais para o desenvolvimento das plantas. O objetivo deste trabalho foi avaliar o comportamento espacial dos micronutrientes em uma área de pastagem extensiva no sudeste do estado do Tocantins. O experimento foi conduzido no Instituto Federal do Tocantins, Campus Dianópolis, Setor de Produção Animal, localizado no município de Dianópolis (TO). O solo avaliado foi classificado como Cambissolo Háplico Distrófico e possui histórico de pastagem extensiva há mais de ١٠ anos. Foram coletadas amostras de solo manualmente em uma grade de pontos de amostragem georreferenciados (25x25m) dentro da área de estudo (aproximadamente 2,0 ha), totalizando 30 amostras compostas, na profundidade de 0-20 cm. De cada amostra de solo analisou a argila, pH, MO e teores dos micronutrientes: boro (B), ferro (Fe), cobre (Cu), manganês (Mn) e zinco (Zn), e submeteu os dados a uma análise geoespacial pelo programa Surfer. A variabilidade dos atributos classificados de acordo com seu coeficiente de variação (CV) apresentou valores altos (CV>60%) para Fe, Mn e Zn, valores médios (15-60%) para Argila, MO, B e Cu e valores baixos (<15%) para pH. Portanto, os atributos pesquisados apresentaram grau de dependência espacial variando de baixa a alta. Porém, foi possível mapear os atributos químicos do solo, onde as maiores variabilidades foram observadas para os micronutrientes Zn, Mn e Fe.
Palavras-chave: Variabilidade, Nutrientes, Solo.
INTRODUCTION
Animal production in Brazil is characterised by the intense use of pastures in an extractive manner, with restricted adoption of technology and intensive use of capital. This can lead to environmental problems and the loss of the productive capacity of soils, thus giving rise to the need for efficient management that increases the productive capacity of pastures and reduces impacts on the environment (Bernardi et al., 2014).
Knowledge of soil fertility using information on spatial variability with the aid of geostatistical techniques enables the adoption of strategies that make it possible to increase the efficiency of pasture management, as well as promoting the homogenisation of average values of soil fertility indicators (Carneiro et al., 2016).
The variability of micronutrients in the soil can lead to deficiencies or excesses of these nutrients in certain areas, which can negatively affect pasture growth and animal health. Such variability in the soil can be caused by the soil’s parent materials and anthropogenic activity (Ramzan & Wani, 2018).
The behaviour of micronutrients, which are required in smaller quantities, can condition the way they are applied, which can be via soil, fertigation, foliar fertilisation or seed treatment, assuming that the recommendation can be made at a variable rate, management zones or in a total area (Gonçalves et al., 2019).
Understanding the spatial and temporal variability of soil attributes, especially chemical and physical, is a critical aspect highlighted in many studies. It has been reported that knowledge of this variation over time and space is necessary to guide agricultural management strategies (Cerri & Magalhães, 2012; Cherubin et al., 2014; Cruz et al., 2011; Gelain et al., 2021b; Lima et al., 2013; Oliveira et al., 2013)a 42-ha test area in Araras, SP, Brazil, was used. Soil properties were determined from samples collected at the beginning of the 2003/2004 harvest season, using a regular 100x100 m grid. Yield assessment was done with a yield monitor (Simprocana. Before establishing any relationship between chemical attributes and crops, it is essential to assess the extent and intensity of the spatial dependence of their variation, either independently or in combination with other variables (Gandah et al., 2000). Plots of spatially dependent contour variables can provide useful information for interventions aimed at correcting adverse changes in soil nutrient supply (Druck et al., 2004).
Evaluating the spatial variability of nutrients available in the soil is a viable option for identifying and delineating critical nutrient deficiency zones. This methodology makes it possible to diagnose nutrient-related limitations and management practices take on greater importance in order to sustain or improve crop productivity (Vasu et al., 2017).
Considering the above, it is necessary to know how micronutrients are distributed in pasture soils in order to make fertiliser recommendations. Therefore, this study aims to assess the spatial behaviour of micronutrients in an extensive pasture area in the southeast of the state of Tocantins.
MATERIAL AND METHODS
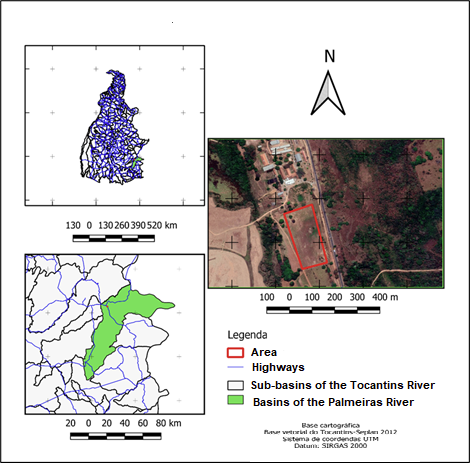
The experiment was conducted in the experimental area of the Federal Institute of Tocantins, Dianópolis Campus – Animal Production Sector, located in the municipality of Dianópolis (TO), at 11°38’13” south latitude and 46°45’52” west longitude, with an altitude of 570 metres. The climate is classified as Aw, according to the Köppen classification system, and is characterised as a humid tropical climate with a rainy season in summer and a dry season in winter.
According to the Brazilian Soil Classification System (Santos, 2018). the soil at the experimental site is classified as a dystrophic Haplic Cambisol, with gently undulating relief and a history of brachiaria grazing for more than 10 years. Soil samples were collected manually in November 2019 (at the start of the first rains) from a grid of georeferenced sampling points (25x25m) within the study area (approximately 2.0 ha), totalling 30 composite samples, each with 3 single samples, at a depth of 0-20 cm.
The chemical attributes of the soil assessed were clay content, pH, organic matter (OM) and levels of micronutrients, including boron (B), iron (Fe), copper (Cu), manganese (Mn) and zinc (Zn). The soil was air-dried, mechanically crushed, sieved through a 2 mm mesh and chemically analysed following the methodology of Raij (Raij et al., 2001).
For each attribute studied, a classic descriptive analysis was carried out using statistical software, calculating the mean, median, minimum and maximum values, coefficient of variation, kurtosis, asymmetry and frequency distribution.
The spatial dependence of each attribute was analysed by calculating the simple semivariogram, based on the stationarity assumptions of the intrinsic hypothesis, using Surfer® ١٣ software. The semivariograms were fitted using the Gs+ software (Robertson, 2008).
The models were selected on the basis of the highest coefficient of determination (R2) and the lowest residual sum of squares (SQR), testing spherical, exponential, Gaussian, linear, linear without threshold and pure nugget effect models. The following parameters were defined in the adjusted semivariograms: nugget effect (C0), level (C0 + C1) and spatial dependence interval (GDE). The relationship between the nugget effect and the plateau allows soil attributes to be categorised and compared.
To analyse the GDE of the attributes under study, the classification proposed by Cambardella et al. (1994) was used, in which semivariograms with weak spatial dependence have a ratio of 25% or less, semivariograms with moderate spatial dependence have a ratio greater than 25% and less than 75%, and those with strong dependence have a ratio greater than 75%.
The isoline maps were generated with Surfer® software, using information from the semivariograms during the Kriging process in data interpolation. For variables where no spatial dependence was observed, the inverse square distance method was used instead of Kriging to generate the maps.
Principal component analysis (PCA) evaluated the soil attributes and demonstrated the relationships between them. The data set was standardised, meaning that each attribute had zero mean and unit variance. This analysis allowed the original variable space to be reduced into a smaller set, preserving the original maximum variability of the data. This analysis was carried out using the R Studio software.
Figure 1
Map of the location of the study area: experimental area of IFTO/campus Dianópolis
RESULTS AND DISCUSSION
The descriptive analysis of the data from the extensive grazing area (Table 1) aims to analyse the behaviour of the soil fertility attributes and identify any that might influence the geostatistical analysis, despite considering them to be spatially independent. The results of this analysis indicate low distribution, where the mean and median values are close for all the variables, demonstrating that the data does not show marked asymmetry. According to Little & Hills (1991), when the mean and median values are similar, the data is in or close to a normal distribution.
According to the Cerrado Soil Correction and Fertilisation Manual, the soil analysed is medium-textured, with low average levels of B (0.046 mg.dm3) and Zn (0.81 mg.dm3), which require correction, and very high levels of Cu (2.67 mg.dm3), Fe (281.5 mg.dm3) and Mn (109.78 mg.dm3), which therefore do not require correction through fertilization (Lobato, 2004).
The variability of the attributes can be classified according to their coefficient of variation (CV). In the area studied, the CVs were high (CV>60%) for Fe, Mn and Zn, medium (15-60%) for Clay, MO, B and Cu and low (<15%) for pH.
According to Lima et al. (2013), the variability of soil chemical attributes is the result of complex interactions between soil formation processes and soil and crop management practices, with an impact mainly on the surface layers of the soil. However, in this study, the variability in attribute data was possibly associated with the effect of the recurring presence of animals in the area.
The asymmetry coefficient (AC) is used to characterize how much the frequency distribution deviates from symmetry. If the value found for this coefficient is zero, the distribution is symmetrical; if it is positive, the distribution is asymmetrical to the right; and if it is negative, it is asymmetrical to the left. Most of the variables showed a frequency distribution that was asymmetrical to the right (+), with the exception of B, which showed a frequency distribution that was asymmetrical to the left (-). The highest asymmetry coefficient value was for Zn (2.34) and the lowest for clay (0.51).
The kurtosis coefficient can also be used to assess whether the data follows a normal distribution, which should preferably be zero and values between +2 and -2 can be accepted (Negreiros Neto et al., 2014). Table 1 shows that the kurtosis coefficient (kC) values of the attributes evaluated were within the limits considered acceptable, except for Cu (4.14), Mn (2.53) and Zn (4.77).
For most of the variables, although asymmetric distributions were found, it was verified, through indications such as similar mean and median values and asymmetry and kurtosis coefficients close to zero, that the measures of central tendency are not dominated by atypical values in the distribution and that they are close to a normal distribution. Thus, according to Cambardella et al. (1994), the data can be considered suitable for the application of geostatistics.
The semivariogram models for the attributes (Table 2) were selected based on the highest R2 values, where clay, pH, B and Fe showed the best fits for the Gaussian model, Cu for the spherical model and MO, Mn and Zn linear. According to Gelain et al. (2021a), when semivariograms are presented as spherical and linear, they show low continuity of spatial variability. However, the Gaussian model consists of a high continuity of spatial variability.
The nugget effect (C0) is within 30 per cent of the plateau (C0+C), classified as low (Andriotti, 2004), showing that the semivariograms explained most of the variation in the experimental data, except for MO, Mn and Zn.
The Range indicates the maximum distance between sampling points that could be adopted and demonstrates the spatial dependence of the attributes, where the observed values were all above the distance of the 30x30 m grid of points adopted. B had the lowest value (46.42 m), but still above the distance between the points adopted, and Mn had the highest value (118.5 m). The more homogeneous the cultivation area, the greater the radius of spatial correlation of the attributes assessed, i.e. the greater the range. The adoption of precision agriculture by treating each need in a timely manner tends to standardise soil fertility, reducing spatial variability and increasing the geostatistical range (Carneiro et al., 2016).
The results of the geostatistical analysis showed that clay, pH, B, Cu and Fe showed a strong degree of spatial dependence (SD) and MO, Mn and Zn showed low values according to the classification of Cambardella et al. (1994), which shows that the semivariograms explain most of the variation in the experimental data (Table 2).
It is important to know the spatial dependence of soil parameters, as management parameters with strong spatial dependence can be subjected to a precise, site-specific fertilisation scheme, ideal for precision agriculture (Lawrence et al., 2020)increasingly sophisticated methods have been developed to describe and manipulate the inherent spatial variability in soil chemical properties within the realms of classical and spatial statistics. In this paper, we reviewed design-based (classical.
The application of geostatistics makes it possible to estimate and map soil properties in unsampled regions. Thus, based on the models obtained from the semivariograms, the values of the soil’s chemical attributes were estimated for unsampled locations by means of interpolation using ordinary kriging. The spatial distribution of the micronutrients generated from their semivariograms is shown in Figure 2.
The kriging maps (Figure 2) show a well-defined spatial distribution of the chemical attributes in the area evaluated, which allowed the identification of homogeneous and specific soil zones that were quite distinct for most of the attributes studied. The maps with high spatial similarity for practical soil management purposes were Cu, B and Mn, with Fe showing a slight lack of uniformity in the central region.
Tomaz et al. (2016) studying the linear and spatial variability of forage production components correlated with soil micronutrient levels observed that the use of the average in traditional sampling can underestimate micronutrient levels in the soil and can result in errors in fertilisation recommendations, with an excess of micronutrient points and others with a deficit, due to their high spatial variability.
It is possible that the period of absence of soil management has benefited the accumulation of these elements in specific places, through the action of microorganisms in the mineralisation of organic matter (OM) and the irregularities of the terrain. The presence of pasture allows the soil to recover, so nutrients tend to increase with the increase in straw (Maza-Villalobos et al., 2022).
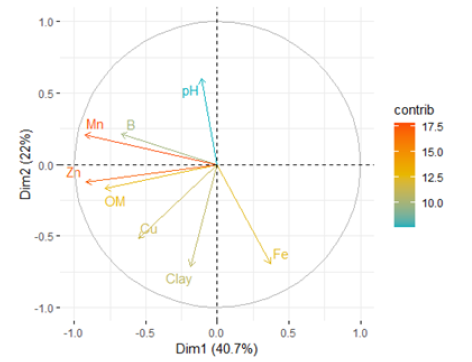
The observed values are affected by the variation of other attributes and fertility points in the area at each sampling point. Therefore, principal component analysis makes it possible to capture the direction of maximum variation in the data set in order to correlate the attributes and generate causality between them (Figure 3).
It can be seen that higher OM levels mainly increase Zn and Mn levels, and to a lesser extent B and Cu levels, the latter being more related to the lower granulometry of the soil (clay) than the other micronutrients mentioned (Zn, Mn and B). In addition, the increase in available Fe levels is related to the increase in clay levels and the decrease in pH (5.9 to 5.3).
The increase in the concentration of organic matter is causally correlated to the increase in cation exchange capacity and pH-dependent charges. Therefore, changes in pH and organic matter are able to regulate the availability of cationic forms (Laurent et al., 2020).
According to Dhaliwal et al. (2019), it is essential to identify the different forms found in the soil, since the mobility and bioavailability of these elements are governed by dynamic processes and not by the total content of the elements. The addition of organic matter via fertilisers, green manures and organic waste redistributes the micronutrients applied in their different fractions.
In general, the relationships between soil properties, nutrients and plant growth are complex and multifaceted. Understanding these relationships can help farmers and agricultural specialists make informed decisions about soil management practices, nutrient application and crop selection, which ultimately leads to greater productivity and agricultural sustainability.
Table 1
Descriptive analysis of the fertility attributes (Clay, pH, OM, B, Cu, Fe, Mn, Zn) of a dystrophic Haplic Cambisol, under extensive pasture, at a depth of 0-20 cm
|
Attribute |
Average |
Median |
Minimum |
Maximum |
CV |
AC |
KC |
|
Clay. (g.Kg-1) |
291,7 |
300 |
175 |
425 |
21,16 |
-0,34 |
0,27 |
|
pH |
5,62 |
5,7 |
5,2 |
5,9 |
3,7 |
-0,88 |
-0,08 |
|
OM(g.kg-1) |
15,67 |
15 |
12 |
49,5 |
51,73 |
1,61 |
1,68 |
|
B (mg.dm-3) |
0,05 |
0,04 |
0,03 |
0,07 |
26,53 |
0,61 |
-0,48 |
|
Cu (mg.dm-3) |
2,67 |
2,5 |
1,5 |
6,2 |
37,74 |
1,71 |
4,14 |
|
Fe (mg.dm-3) |
281,46 |
202,95 |
40,1 |
929,7 |
82,54 |
1,32 |
1,09 |
|
Mn (mg.dm-3) |
109,78 |
77,6 |
22,8 |
307,1 |
66,18 |
1,71 |
2,53 |
|
Zn (mg.dm-3) |
0,81 |
0,3 |
0,1 |
4,4 |
137,03 |
2,34 |
4,77 |
OM= organic matter; B= boron; Fe= Iron; Cu= Copper; Mg= Manganese= Zn= Zinc; CV: variation coefficient, KC: kurtosis coefficient; AC: asymmetry coefficient.
Table 2
Parameters of the semivariograms of the fertility attributes (Clay, pH, MO, B, Cu, Fe, Mn and Zn) of a dystrophic Haplic Cambisol under extensive grazing, at depths of 0-20 cm
|
Attribute |
Model |
Co |
Co+C |
Range |
R2 |
SQR |
C/[Co+C]) |
GDE |
|
Clay. (g/kg-1) |
Gaus. |
10 |
4795 |
73,96 |
0,935 |
1432615 |
0,998 |
FD |
|
pH |
Gaus. |
0,0001 |
0,0527 |
69,63 |
0,893 |
2,14*10-4 |
0,998 |
FD |
|
OM(g.kg-1) |
Lin. |
207,36 |
207,36 |
118,12 |
0,354 |
287585 |
0,000 |
BD |
|
B(mg.dm3) |
Gaus. |
0,0000 |
0,000154 |
46,42 |
0,750 |
2,85*10-9 |
0,999 |
FD |
|
Cu(mg.dm3) |
Esfe. |
0,078 |
0,816 |
54,5 |
0,415 |
0,162 |
0,904 |
FD |
|
Fe(mg.dm3) |
Gaus. |
100 |
57290 |
54,73 |
0,785 |
7,75*108 |
0,998 |
FD |
|
Mn(mg.dm3) |
Lin. |
5240,5 |
5240,5 |
118,5 |
0,051 |
2,54*107 |
0,000 |
BD |
|
Zn (mg.dm3) |
Lin. |
1,653 |
1,653 |
118,12 |
0,279 |
20 |
0,000 |
BD |
OM= Organic matter B= Boron; Fe= Iron; Cu= Copper; Mg= Manganese= Zn= Zinc; Gaussian; Spherical; Lin= linear; Co= nugget variance; Co+C= level; R2 = coefficient of determination; SQR = sum of the squares of the residuals; GDE: degree of spatial dependence; FD: strong dependence; BD: low dependence.
Figure 2
Contour maps of the spatial distribution of the attributes assessed (clay, pH, OM Cu, B, Fe, Mn, Zn) in a dystrophic Haplic Cambisol under extensive grazing at a depth of 0-20 cm
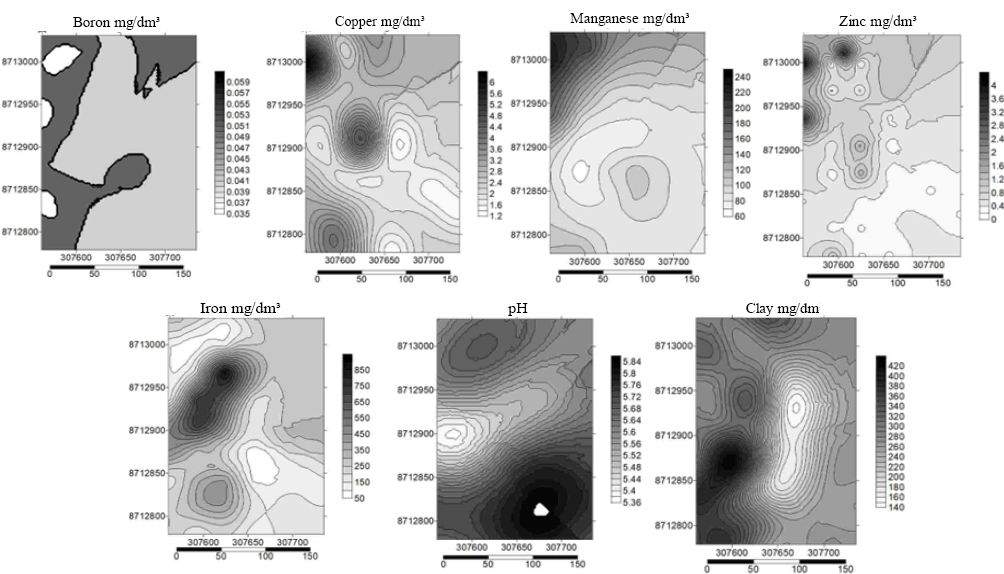
Figure 3
Principal component analysis of the soil’s chemical and physical attributes in the standardised unit
CONCLUSION
The results of the geostatistical analysis showed that clay, pH, B, Cu and Fe presented a strong degree of spatial dependence (GDE) and MO, Mn and Zn presented low values. Therefore, through the spatial maps, a greater variability of the micronutrients Zn, Mn and Fe was observed and a need for sampling points that should be between 46.42 and 118.5 meters.
REFERENCES
Andriotti, J. L. S. (2004). Fundamentos de Estatística e Geoestatística. (1st ed.). Editora Unisinos.
Bernardi, A. C. de C., Naime, J. de M., Resende, A. V., Bassoi, L. H., & Inamasu, R. Y. (Eds.). (2014). Agricultura de precisão: Resultados de um novo olhar. (1st ed.). Embrapa.
Cambardella, C. A., Moorman, T. B., Novak, J. M., Parkin, T. B., Karlen, D. L., Turco, R. F., & Konopka, A. E. (1994). Field-scale variability of soil properties in Central Iowa soils. Soil Science Society of America Journal, 58(5), 1501-1511. https://doi.org/10.2136/sssaj1994.03615995005800050033x
Carneiro, J. S. da S., Santos, A. C. M. dos, Fidelis, R. R., Neto, S. P. da S., Santos, A. C. dos, & Silva, R. R. da. (2016). Diagnóstico e manejo da variabilidade espacial da fertilidade do solo no cerrado do Piauí. Revista de Ciências Agro-Ambientais, 14(2), Article 2. https://doi.org/10.5327/rcaa.v14i2.1469
Cerri, D. G. P., & Magalhães, P. S. G. (2012). Correlation of physical and chemical attributes of soil with sugarcane yield. Pesquisa Agropecuária Brasileira, 47(4), 613-620. https://doi.org/10.1590/S0100-204X2012000400018
Cherubin, M. R., Santi, A. L., Eitelwein, M. T., Menegol, D. R., Ros, C. O. da, Pias, O. H. de C., & Berghetti, J. (2014). Eficiência de malhas amostrais utilizadas na caracterização da variabilidade espacial de fósforo e potássio. Ciência Rural, 44, 425-432. https://doi.org/10.1590/S0103-84782014000300007
Cruz, J. S., Assis Júnior, R. N., Matias, S. S. R., & Camacho-Tamayo, J. H. (2011). Spatial variability of an Alfisol cultivated with sugarcane. Ciencia e Investigación Agraria, 38(1), 155-164. https://doi.org/10.4067/S0718-16202011000100015
Dhaliwal, S. S., Naresh, R. K., Mandal, A., Singh, R., & Dhaliwal, M. K. (2019). Dynamics and transformations of micronutrients in agricultural soils as influenced by organic matter build-up: A review. Environmental and Sustainability Indicators, 1-2, 100007. https://doi.org/10.1016/j.indic.2019.100007
Druck, S., Carvalho, M. S., Câmara, G., & Monteiro, A. M. V. (Eds.). (2004). Análise espacial de dados geográficos. (1st ed.). Embrapa Informação Tecnológica.
Gandah, M., Stein, A., Brouwer, J., & Bouma, J. (2000). Dynamics of spatial variability of millet growth and yields at three sites in Niger, West Africa and implications for precision agriculture research. Agricultural Systems, 63(2), 123-140. https://doi.org/10.1016/S0308-521X(99)00076-1
Gelain, E., Bottega, E. L., Motomiya, A. V. de A., & Oliveira, Z. B. de. (2021a). Variabilidade Espacial e correlação dos atributos do solo com produtividade do milho e da soja. Nativa, 9(5), Article 5. https://doi.org/10.31413/nativa.v9i5.11717
Gelain, E., Bottega, E. L., Motomiya, A. V. de A., & Oliveira, Z. B. (2021b). Variabilidade espacial e correlação dos atributos do solo com produtividade do milho e da soja. Nativa, 9(5), Article 5. https://doi.org/10.31413/nativa.v9i5.11717
Gonçalves, A. S. F., Oliveira Neto, S. S. de, & Machado, G. G. (2019). Uso de micronutrientes na agricultura: Efeitos e aplicações. Revista Agronomia Brasileira, 3(3). https://doi.org/10.29372/rab201912
Laurent, C., Bravin, M. N., Crouzet, O., Pelosi, C., Tillard, E., Lecomte, P., & Lamy, I. (2020). Increased soil pH and dissolved organic matter after a decade of organic fertilizer application mitigates copper and zinc availability despite contamination. Science of The Total Environment, 709, 135927. https://doi.org/10.1016/j.scitotenv.2019.135927
Lawrence, P. G., Roper, W., Morris, T. F., & Guillard, K. (2020). Guiding soil sampling strategies using classical and spatial statistics: A review. Agronomy Journal, 112(1), 493-510. https://doi.org/10.1002/agj2.20048
Lima, J. S. de S., Silva, S. de A., & Silva, J. M. da. (2013). Variabilidade espacial de atributos químicos de um Latossolo Vermelho-Amarelo cultivado em plantio direto. Revista Ciência Agronômica, 44(1), 16-23. https://doi.org/10.1590/S1806-66902013000100003
Little, T. M., & Hills, F. J. (Eds.). (1991). Agricultural experimentation design and analysis. (1st ed.). John Wiley & Sons.
Lobato, E. (2004). Cerrado: Correção do solo e adubação. (2nd ed.). Embrapa Informação Tecnológica.
Maza-Villalobos, S., García-Ramírez, P., Endress, B. A., & Lopez-Toledo, L. (2022). Plant functional traits under cattle grazing and fallow age scenarios in a tropical dry forest of Northwestern Mexico. Basic and Applied Ecology. https://doi.org/10.1016/j.baae.2022.06.006
Negreiros Neto, J. V. D., Santos, A. C. D., Guarnieri, A., Souza, D. J. D. A. T., Daronch, D. J., Dotto, M. A., & Araújo, A. D. S. (2014). Variabilidade espacial de atributos físico-químicos de um Latossolo Vermelho-Amarelo distrófico em sistema plantio direto. Semina: Ciências Agrárias, 35(1), 193. https://doi.org/10.5433/1679-0359.2014v35n1p193
Oliveira, I. A., Campos, M. C. C., Soares, M. D. R., Aquino, R. E., Marques Júnior, J., & Nascimento, E. P. (2013). Variabilidade espacial de atributos físicos em um cambissolo háplico, sob diferentes usos na região sul do Amazonas. Revista Brasileira de Ciência Do Solo, 37(4), 1103-1112. https://doi.org/10.1590/S0100-06832013000400027
Raij, B. van, Andrade, J. C., Cantarella, H., & Quaggio, J. A. (Eds.). (2001). Análise química para avaliação da fertilidade de solos tropicais. Instituto Agronômico.
Ramzan, S., & Wani, M. A. (2018). Geographic information system and geostatistical techniques to characterize spatial variability of soil micronutrients including toxic metals in an agricultural farm. Communications in Soil Science and Plant Analysis, 49(4), 463-477. https://doi.org/10.1080/00103624.2018.1431264
Robertson, G. P. (2008). GS+: Geostatistics for the environmental sciences [Computer software]. Gamma Design Software, LLC. https://geostatistics.com/
Santos, H. G. dos. (2018). Sistema brasileiro de classificação de solos (5ª ed. rev. e amp.). Embrapa.
Tomaz, P. K., Montaneri, R., Andreotti, M., & Panosso, A. R. (2016). Linear and spatial variability of fodder productive components correlated with micronutrient levels of the soil. Journal of Geospatial Modelling, 2(1), 12. https://doi.org/10.22615/2526-1746-jgm-2.1-5886
Vasu, D., Singh, S. K., Sahu, N., Tiwary, P., Chandran, P., Duraisami, V. P., Ramamurthy, V., Lalitha, M., & Kalaiselvi, B. (2017). Assessment of spatial variability of soil properties using geospatial techniques for farm level nutrient management. Soil and Tillage Research, 169, 25-34. https://doi.org/10.1016/j.still.2017.01.006