
Artigo original
ROOT PARAMETERS AND PHYSICAL SOIL ATTRIBUTES WITH FORAGE GROWTH OF Panicum and Urochloa GRASSES FORAGE
Parâmetros de raiz e atributos físicos do solo com cultivo de forrageiras dos gêneros Panicum e Urochloa
Victor Hugo Custodio Policarpo* Rones Dias da Costa† Hemython Luis Bandeira Nascimento‡ Rose Luiza Moraes Tavares§
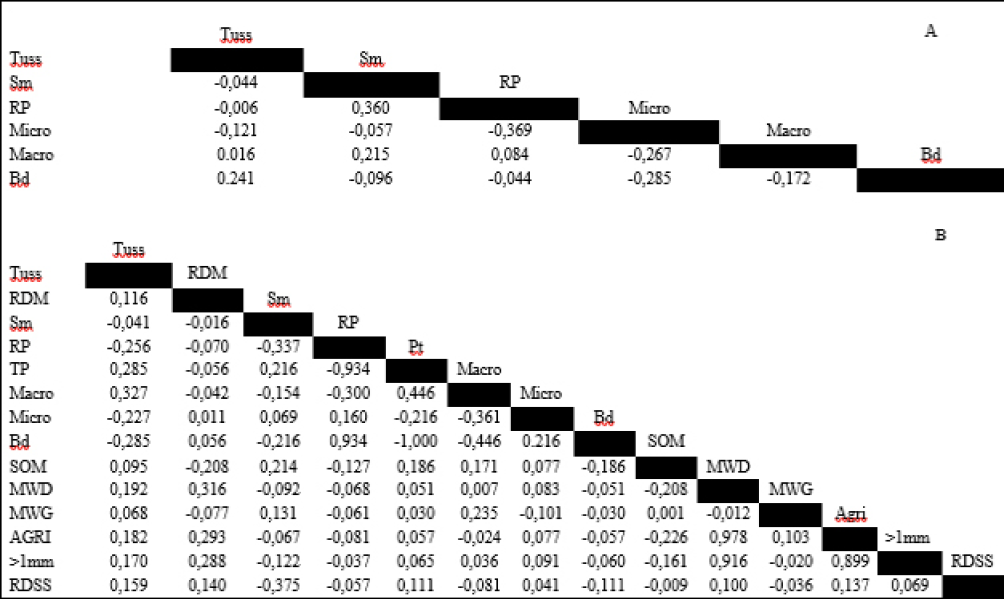 Camila Jorge Barnabé Ferreira¶ Paulo Fernandes Boldrin**
https://doi.org/10.18593/evid.32576
Recebido em 06 de março de 2023 | Aceito em 13 de julho de 2023
Abstract:
The grasses of the Panicum and Urochloa forages are important plant species that improve the physical quality of the soil, due their aggressive root system and rapid establishment. Based on this, the aim of this work was to evaluate the effect of different forage species of the forages Panicum and Urochloa on soil physical quality for two agricultural years. For this purpose, 11 forage cultivars were planted, organized in an experimental design with randomized blocks, containing 3 blocks and 33 experimental plots, with dimensions of 4 x 4 m each plot. This purpose was implemented on November 23, 2019 and the experimental period was from February 20, 2020 to May 12, 2021. Sowing was carried out manually by broadcast, to ensure rapid establishment and ideal plant stand. In 2020, root attributes (tussock population and dry root mass) and soil physics (moisture, resistance to penetration, micro and macroporosity and bulk density) were evaluated. In 2021, the same evaluations were repeated, adding dry root mass, soil aggregates (Mean weight-diameter – MWD and geometric – MWG, percentage of aggregates > 2 mm -AGRI and aggregates > 1 mm.), organic material and the rapid diagnosis of soil structure - RDSS. Principal component analysis was used for data interpretation. The Zuri and Sabiá grass species were the ones that most explained the variations in tussock population and soil moisture. Many of the variables were more expressive in the environment with Zuri grass, indicating the potential of the species compared to the others.
Keywords: Grass. Brazilian Cerrado. Soil quality.
Resumo:
As gramíneas do gênero Panicum e Urochloa são importantes espécies vegetais que melhoram a qualidade física do solo, devido seu sistema radicular agressivo e rápido estabelecimento. Baseado nisso, o objetivo deste trabalho foi avaliar o efeito de diferentes espécies de forrageiras do gênero Panicum e Urochloa na qualidade física do solo por dois anos agrícolas. Para isso, foram plantadas 11 cultivares de forrageiras, organizadas em delineamento experimental com blocos ao acaso, contendo 3 blocos e 33 parcelas experimentais, com dimensão de 4 x 4 m cada parcela. O experimento foi implantado em 23 de novembro de 2019 e o período experimental foi de 20 de fevereiro de 2020 a 12 de maio de 2021. A semeadura foi de forma manual a lanço, para garantir o rápido estabelecimento e ideal estande de plantas. Em 2020 foram avaliados atributo de raíz (densidade de touceira) e de física do solo (umidade, resistência à penetração, micro e macroporosidade e densidade do solo). Em 2021, foram repetidas as mesmas avaliações, acrescidas de massa seca de raíz, agregados (diâmetro médio monderado - DMP e geométrico - DMG, porcentagem de agregados > 2 mm -AGRI e agregados > 1 mm.), matéria orgânica e diagnóstico rápido da estrutura do solo. Foi utilizada análise de componentes principais para interpretação dos dados. As espécies capim zuri e sabiá foram as que mais explicaram as variações da densidade de touceira e umidade do solo. Muitas variáveis foram mais expressivas no ambiente com capim zuri, indicando o potencial da espécie mediante as demais.
Palavras-chave: Capim. Cerrado. Qualidade do solo.
@Autor correspondente: Prof. Faculdade de Agronomia e Programa de Pós-graduação em Produção Vegetal da Universidade de Rio Verde (UniRV), pós-graduação em produção vegetal pela Universidade de Rio Verde (UniRV), Rio Verde, Goiás, Brasil, www.unirv.edu.br; Universidade de Rio Verde, Fazenda Fontes do Saber, s/n, Rio Verde – Goiás, Brasil, 75901-970; https://orcid.org/0000-0003-4672-8470; roseluiza@unirv.edu.br.
1 INTRODUCTION
Soil is an active and dynamic natural system whose functions include providing the physical environment for plant growth, delimiting water flow in the environment, and facilitating nutrient cycling1-2. Its adequate management promoted ideal conditions for the growth and development of crops. Thus, a soil with appropriate structure conditions, provides good hydraulic conductivity and resistance to erosion1,3.
Soil quality indicators should respond to management in a way that is relevant to soil function and can be measured easily and cheaper. A good indicator is directly related to the good productivity and sustainability of the system4. They can be divided into three groups: physical, chemical and biological properties2. Among the most applied physical properties, we can mention soil resistance to penetration, evaluated directly in the field, as well as soil density and porosity, parameters that are directly associated with crop productivity5.
Management practices suggested to improve physical quality include the use of integrated production systems, such as Crop-Livestock Integration (CLI), where the presence of forage and animals in the area become one of the main improvement factors, as the abundant root system of the grass, promotes improvements in porosity and water permeability, mainly due to its effect as a decompressor, in addition, the presence of the animal in the area contributes to greater nutrient cycling because it is a depository of its excrements in the area and grazing stimulates the tillering of grasses and root growth. During senescence, roots form pores that help stabilize soil aggregates and reduce soil compaction and infiltration resistance4.
Forage plants, mainly grasses such as Urochloas and Panicuns, benefit crop systems, because they have a root system with the potential to improve the soil, specifically helping in the formation of stable aggregates and macropores as aeration channels, whose benefits provide a propitious environment for the root system of the next crop that will be established, such as soybean6, the main agricultural crop of the Brazilian savanna.
Other benefits that can be crucial in the incorporation of these forages to the system are the weeds suppression, the interruption of the biological cycle of pests and diseases, as well as the improvement of the physical properties of the soil, such as lower soil bulk density and, therefore, soil resistance to compaction due to reduced evaporation and increased sensitivity, in addition to reduced water loss7-9.
The usage of adequate management practices whose support soil conservation can promote more favorable soil conditions for sowing and attenuate productivity losses7. In addition to the benefits of improving soil physical properties, forages have other benefits in crop production environments, such as increasing soil organic material.
Therefore, the use of forages in agricultural areas is a beneficial practice for soil structure and root development. Based on this, the aim of this work was to evaluate root variant and physical attributes of the soil with forage cultivation of the Panicum and Urochloa species, in Rio Verde-GO.
2 MATERIAL AND METHODS
2.1 EXPERIMENTAL AREA
The experiment was carried out in field at the COMIGO Technological Center (CTC) appurtenant to the COMIGO co-op in Rio Verde/GO, Brazil. The region is located at geographic coordinates 17º 76’ 75.30” South and 51º 03’ 54.23” West, with an Aw tropical climate. 23.3 °C according to Köppen, altitude of 739 meters and Red Latosol soil10.
The soil was characterized as Latossolo Vermelho11 or Haplutox12. Before soil preparation, an analysis was performed at a depth of 0-20 cm. The results were pH (CaCl2) 4.35; organic matter (OM) 2.82%; P (Mehlich-1) 23.8 mg dm-3; K 130 mg dm-3; Ca 1.4 cmolc dm-3; Mg 0.49 cmolc dm-3; cation exchange capacity (CEC) 3 cmolc dm-3; calcium saturation (Ca/CEC) 46%; magnesium saturation (Mg/CEC) 16%; potassium saturation (K/CEC) 11%; base saturation (V%) 73%; and particle size 36.5% clay, 7.0% silt, and 56.5% sand.
2.2 TREATMENTS
The experiment involved planting 11 cultivars of tropical forage grasses, including 7 Urochloa cultivars and 4 Panicum cultivars. The experimental design used was a randomized complete block design with 4 replicates, resulting in a total of 44 experimental plots.
The experimental design was randomized blocks with four replications. Treatments consisted of 11 tropical forage grasses: seven Urochloa and four Panicum cultivars. The forage grasses used were: BRS Paiaguás (Urochloa brizantha cv. BRS Paiaguás); BRS Ipyporã (Urochloa cv. BRS Ipyporã); MG13 Braúna (Urochloa brizantha cv. MG13 Braúna); Mulato II (Urochloa hybrida cv. Mulato II); Mavuno (Urochloa hybrid cv Mavuno grass); Sabiá (Urochloa hybrid cv. Sabiá); Cayana (Urochloa hybrid cv. Cayana); BRS Quênia (Panicum maximum cv. BRS Quênia); BRS Zuri (Panicum maximum cv. BRS Zuri); BRS Tamani (Panicum maximum cv. BRS Tamani) and Paredão (Panicum maximum cv. MG12 Paredão).
The plots were dimensioned in size of 4 m x 4 m (16 m²). Forage planting was carried out using the broadcast method. But before planting, the area was stirred and 2 t ha-1 of dolomitic limestone was applied to increase the levels of calcium and magnesium, comprising approximately of 35% calcium oxide (CaO), 12% magnesium oxide (MgO), and total neutralizing power (TNP) of 85%, mechanically prepared. On 11/13/2019, glyphosate was applied at a dose of 1.3 kg a.i. ha-1 to eliminate weeds in the area.
For the sowing of forage grasses, commercial seeds with the cultural value (CV) were used balanced at 80%, the following sowing rates were adopted: 7.0 kg ha-1 of seeds of the Megathyrsus maximus (BRS Zuri, BRS Tamani, BRS Quênia and MG12 Paredão), 10 kg ha-1 for Urochloa brizantha cultivars (BRS Paiguás and MG13 Braúna) and 12 kg ha-1 for Urochloa hybrids (Mulato II, Mavuno, Sabiá, Cayana and BRS Ipyporã).
At planting, the soil was fertilized with 50 kg ha-1 of K2O (KCl) + 60 kg ha-1 of P2O5 (MAP). Subsequently, there was a maintenance fertilization in which nitrogen, potassium, micronutrients and sulfur were applied as following: 200 kg ha-1 of N and K (in 4 applications of 50 kg ha-1 applied always after cutting) using source or formulated 20-00-20 + 40 kg ha-1 of S (45 kg ha-1 of Sulfurgran) + 100 kg ha-1 of FTE BR12.
At 60 days after sowing (23/01/2020), the forage grasses were cut at 30 cm above the soil to standardize the forage grasses using a costal bar pruner, with mower-type blades.
During the experimental period, 15 cuts, for evaluation, were performed. The accumulated production of forage over the experimental period was divided into three periods, depending on the year and weather conditions, according to the Water Balance of the region for the period (Figure 1), being considered as “water 1” (02/20 to 04/16/2020), “dry” (04/17 to 09/30/2020) and “water 2” (10/01/2020 to 05/12/2021).
The sequential water balance was determined following the method of Thornithwaite and Mather using the proposed model by Rolim13 to obtain the Water Excess and Deficit values for the region in the specific periods. Precipitation data were collected at the Centro Tecnológico COMIGO and the average daily temperature was extracted from the INMET meteorological station located in Rio Verde - GO.
The determination of dry mass (DM) availability was carried out in each forage cut on pre-set dates, as previously mentioned. Two forage mass collections were carried out for each plot, using a square frame measuring 0.25 m² (0.5 m x 0.5 m), cut with the aid of a manual cutter, at pre-established residue heights, with the 15 cm above the soil for the Urochloa brizantha cultivars BRS Paiaguás and MG13 Braúna and for the hybrid cultivars of the Urochloa (Mulato II, Mavuno, Sabiá, Cayana and BRS Ipyporã).
For Megathyrsus maximus BRS Zuri, BRS Quênia and MG 12 Paredão cultivars, the cutting height was 30 cm above the soil and for BRS Tamani 20 cm. The cuts were carried out at breaks of 28 days until June´s month, between June and September, due to the great reduction in forage growth, the cut intervals were extended to 56 days, due to the lower growth of forage through the dry season.
Green forage samples were weighed, later on separated into 500 g subsamples, to estimate DM, using forced air circulation oven at 65°C for 72 hours. Before collecting the samples, the height of the forage canopy was measured at 10 points per plot, randomly using a measuring stick.
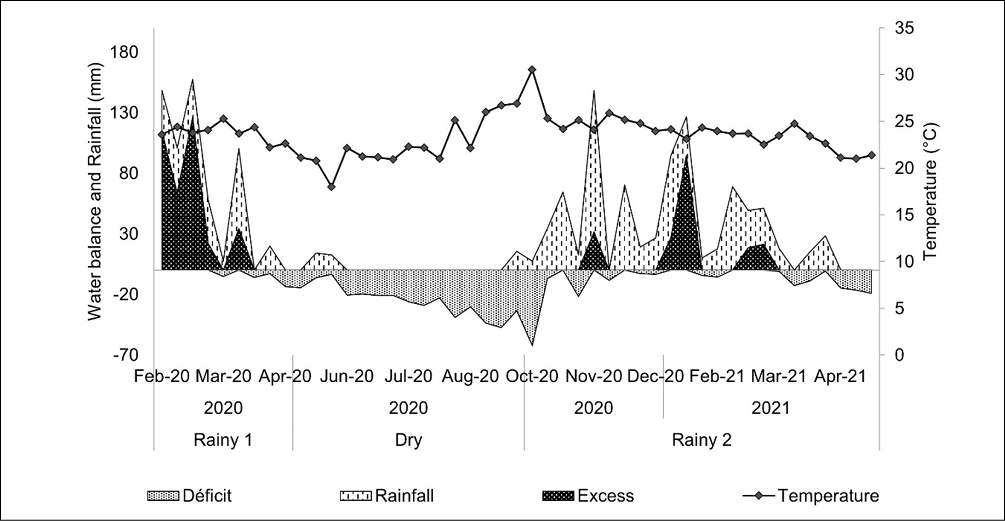
Figure 1 – Sequential water balance of the experimental area, based on climate data in Rio Verde - GO, from February 2020 to May 2021.
2.3 SOIL SAMPLING AND ANALYSIS
Soil sampling and resistance to penetration evaluation were carried out in the 0-20 cm soil layer at the beginning of the dry period in the years 2020 and 2021, and in the first year root parameters (tussock population) and soil physical aspects (moisture - Sm, resistance to penetration - RP, bulk density - Bd, total porosity – TP, macroporosity – Ma and microporosity - Mi). While in the second year the same parameters were evaluated with the addition of: organic material, soil aggregates (mean weight-diameter – MWD and geometric – MWG, AGRI and aggregates > 1 mm), rapid diagnosis of soil structure – RDSS and root dry mass - RDM.
Soil bulk density assessments; macroporosity, microporosity and soil moisture were determined following the methodology proposed by Teixeira14. Soil resistance to penetration was measured in the field using an electronic penetrometer to a depth of 20 cm, as described in Molin15.
Soil organic material was determined by the walkey-black method, oxidation of organic material with potassium dichromate in a strongly acid medium16.
The of aggregates were determined by sieving, through aggregates collected and sieved with 2.00; 1.00; 0.50; 0.25; 0.125 mm, according to the methodology described by Kemper and Chepil17. Equipped with the percentages of aggregates retained in each sieve and the average diameter of the aggregate size ranges, in millimeters, the MWG was determined, which shows the most frequent size of the aggregates, and the MWD, which is an estimate of the relative amount of soil in each aggregate class and is expressed in millimeters. The AGRI demonstrates the percentage of aggregates >2.00 mm18.
2.4 RAPID DIAGNOSIS OF SOIL STRUCTURE – RDSS
The analysis of the Rapid Diagnosis of Soil Structure (RDSS) took place according to the methodology proposed by Ralisch19, which recommends the evaluation of soil blocks samples, preserving the structure as close as possible to the original condition of the soil in the field.
For this, the soil sample collection point was previously moistened to keep the ideal collection and evaluation soil conditions, that is, 48 h (recommended time for clayey soils) before the evaluation, 30 L of water m-2 were placed to maintain the friable soil consistency. After that, a block of soil with dimensions of 10 x 20 x 25 cm in width, length and depth, respectively, was removed from the longest and less damaged wall.
The block was placed in a plastic tray so that it could be fragmented from the center to the sides of the tray, applying a slight torsion force, with hands, to break the blocks and obtain the peds (aggregates).
The evaluation was carried out in layers of soil depth, varying from 1-3 layers, to be demarcated according to the visual aspect of homogeneity and aggregate sides. After that, a RDSS score was given per layer and the depth of each layer was noted following the criteria of the RDSS field chart that takes into account the size of aggregates.
2.5 TUSSOCK POPULATION AND DRY ROOT MASS
To analyze the number of tussock per m2, a 1 m2 template (PVC square) was used and placed randomly in each plot. Within each template, the number of tussock in square area-2 was counted. From this, manually, the root system of a tussock was collected inside the template. After collection, the root was washed with a pressure jet and placed on a set of sieves to facilitate washing. After that, they were placed to dry in an oven at 65 ºC for 72 hours to obtain root dry root mass.
2.6 STATISTICAL ANALYSIS
Data reading was performed using principal component analysis (PCA), which is a multivariate statistical technique able to explain the soil variance structure data through linear correlations (Pearson) of the evaluated variables with the principal components (PC)20-21 whose objective is to identify, in a set of data, a variable that is capable to explain a significant part of the variance, through linear correlations22-23.
For this purpose, a correlation analysis was first performed for selection of variables, with the aim of selecting variables that did not show collinearity. After that, the PCA was applied by standardizing the attribute units with average corresponding to 0 and variance corresponding to 124.
With this technique, we intend to know and interpret the most important information contained in samples with several correlated variables. The original variables are reduced into new variables (principal components), which are not correlated with each other (orthogonal) and which are functions of linear combinations of the original variables.
Thus, the first component will absorb the greatest variability in the data; the second component will absorb the greatest possible variability, imposed on the condition of orthogonality and, so on, successively25. The statistical program used for PCA was Statistic 7.0 (Stat Soft®).
Forage production data were analyzed using the mixed model method with a special parametric structure in the covariance matrix, through the mixed procedure of the SAS statistical software26. Forages were considered fixed effects, blocks and repetitions were considered random effects. To choose the covariance matrix, the Akaike information criterion was used27. The averages of the treatments were estimated by the “LSMEANS” and the comparison was performed by the Tukey test with a significance level of 5%.
3 RESULTS AND DISCUSSION
The average data of most of the evaluated attributes (Table 1) showed non-significant differences between the forages in the two evaluated years.
Table 1 – Average data of root parameters and soil physical attributes evaluated at the 2020 and 2021 off-season in Rio Verde-GO
|
2020 |
||||||||||
|
Forages Grasses |
Tuss |
Sm |
Micro |
Macro |
Bd |
|||||
|
touc m-² |
kg kg-1 |
----- m3 m-3 ----- |
Mg dm-3 |
|||||||
|
Brauna |
22.67 |
0.16 |
0.99 |
0.23 |
1.34 |
|||||
|
Paiaguas |
20.00 |
0.18 |
0.92 |
0.33 |
1.19 |
|||||
|
Cayana |
24.67 |
0.18 |
0.99 |
0.23 |
1.24 |
|||||
|
Ipypora |
24.67 |
0.17 |
0.95 |
0.30 |
1.33 |
|||||
|
Mavuno |
31.67 |
0.18 |
0.77 |
0.28 |
1.29 |
|||||
|
Mulato II |
23.67 |
0.16 |
0.92 |
0.28 |
1.06 |
|||||
|
Sabia |
22.00 |
0.19 |
1.09 |
0.23 |
1.15 |
|||||
|
Paredao |
21.33 |
0.17 |
0.96 |
0.29 |
1.39 |
|||||
|
Quenia |
22.00 |
0.17 |
0.97 |
0.26 |
1.28 |
|||||
|
Tamani |
23.33 |
0.19 |
0.86 |
0.26 |
1.17 |
|||||
|
Zuri |
29.33 |
0.16 |
0.94 |
0.27 |
1.40 |
|||||
|
2021 |
||||||||||
|
Forages Grasses |
Tuss |
RDM |
Sm |
Micro |
Macro |
Bd |
SOM |
MWD |
MWG |
RDSS |
|
touc m-² |
kg ha-1 |
kg kg-1 |
--- m3 m-3 --- |
Mg dm-3 |
g kg-1 |
--- mm --- |
- |
|||
|
Brauna |
14.75 |
3317.73 |
0.10 |
0.28 |
0.25 |
1.29 |
36.22 |
0.97 |
1.19 |
5.34 |
|
Paiaguas |
12.25 |
1499.70 |
0.10 |
0.26 |
0.25 |
1.31 |
36.18 |
0.73 |
1.47 |
5.01 |
|
Cayana |
16.50 |
4085.07 |
0.11 |
0.31 |
0.26 |
1.29 |
33.30 |
1.54 |
1.43 |
5.32 |
|
Ipypora |
11.25 |
2548.00 |
0.11 |
0.28 |
0.25 |
1.29 |
34.10 |
0.98 |
1.21 |
4.73 |
|
Mavuno |
13.00 |
3196.37 |
0.10 |
0.26 |
0.25 |
1.28 |
33.27 |
0.89 |
1.30 |
5.65 |
|
Mulato II |
14.75 |
2727.87 |
0.11 |
0.30 |
0.26 |
1.27 |
36.10 |
0.82 |
1.33 |
5.35 |
|
Sabia |
10.50 |
2783.07 |
0.16 |
0.28 |
0.26 |
1.22 |
36.15 |
0.84 |
1.33 |
4.73 |
|
Paredao |
12.00 |
2457.30 |
0.10 |
0.27 |
0.25 |
1.32 |
38.01 |
0.90 |
1.28 |
5.11 |
|
Quenia |
11.75 |
978.30 |
0.09 |
0.27 |
0.26 |
1.27 |
33.88 |
1.18 |
1.18 |
5.58 |
|
Tamani |
11.25 |
2076.60 |
0.10 |
0.30 |
0.27 |
1.30 |
36.54 |
1.13 |
1.26 |
4.77 |
|
Zuri |
14.00 |
3394.40 |
0.10 |
0.31 |
0.21 |
1.30 |
32.43 |
0.97 |
1.24 |
5.68 |
Tuss: tussock population; RDM: root dry mass; Sm: soil moisture; Micro: microporosity; Macro: macroporosity; Bd: bulk density; SOM: organic material; MWD: weighted mean diameter; MWG: geometric mean diameter; RDSS: rapid diagnosis of soil structure.
For forage production, significant differences were verified between forage plants in all evaluated periods (p < 0.05). During the rainy period (2020), it was verified that the Zuri and Paredão grasses presented the highest accumulation of forage, with an average increase of 65% in forage production in relation to the other forages (p = 0.003), except in relation to the Quênia grass, which showed no difference in relation to Zuri and Paredão grasses (Table 2). Quênia grass showed an average increase of 52% in forage accumulation in relation to Brachiaria, with the exception of Mavuno grass, which did not differ in relation to Quênia.
During the dry period, the accumulation of forage from Paiaguás, Cayana, Mavuno, and Mulato II grasses showed an average increase of 81% compared to Quenia and Zuri grasses (p < 0.05), while no significant differences were observed among the other forage varieties. In the rainy season of 2020-2021, the accumulation of forage from Zuri and Paredão grasses exhibited an average increase of 50% compared to hybrid Brachiarias Ipyporã, Mavuno, Mulato II, and Sabiá (p < 0.05). Additionally, BRS Quênia demonstrated a 61% higher forage accumulation compared to Ipyporã grass, with no significant differences observed among the other forage plants.
Table 2 – Forage accumulation (kg ha-1) of forage grasses of the Panicum and Urochloa during different year periods, in Rio Verde.
|
Forages Grasses |
Period |
||
|
Rainy 2020 |
Dry 2020 |
Rainy 2020 - 2021 |
|
|
Braúna |
9,884 c |
3,972 ab |
18,065 abc |
|
Paiaguás |
8,210 c |
4,251 a |
16,659 abc |
|
Cayana |
10,259 c |
4,646 a |
16,502 abc |
|
Ipypora |
9,749 c |
4,018 ab |
12,366 c |
|
Mavuno |
11,396 bc |
4,706 a |
14,440 bc |
|
Mulato |
9,704 c |
4,539 a |
14,135 bc |
|
Sabia |
9,718 c |
3,362 ab |
15,141 bc |
|
Paredão |
16,410 a |
3,142 ab |
21,068 a |
|
Quênia |
14,590 ab |
2,489 b |
19,947 ab |
|
Tamani |
11,427 bc |
4,084 ab |
17,642 abc |
|
Zuri |
16,790 a |
2,509 b |
21,076 a |
|
p – value |
0,0003 |
0,0009 |
< 0,0001 |
Averages followed by different letters in the column, differ statistically by Tukey’s test at 5%.
The correlation analysis revealed significant interactions (p<0.05) between some evaluated soil attributes, and those with the highest number of correlations were removed from the principal component analysis, as suggested for this type of analysis (Figure 2).
Figure 2 – Correlation analysis between tussock population, root dry mass and soil physical attributes in an area with different forage management evaluated at the end of the 2020 (A) and 2021 (B) off-season in Rio Verde-GO. Highlighted in red for variables excluded from PCA. Tuss: tussock population; RDM: root dry mass; Sm: soil moisture; RP: resistance to penetration; TP: total porosity; Macro: macroporosity; Micro: microporosity; Bd: soil bulk density; SOM: organic material; MWD: Mean weight-diameter – MWD; Mean weight-geometric – MWG; AGRI: percentage of aggregates > 2mm; > 1 mm: aggregates larger than 1 mm; RDSS: rapid diagnosis of soil structure.
Thus, for the 2020 data, the soil resistance to penetration (RP) attribute was removed from the PCA because it has a significant correlation with soil moisture (Sm) of -0.33 and microporosity (Mi) of –0.36 (Figure 2). For the 2021 data, more attributes were removed, namely: PR that correlated with Sm (-0.33), TP (-0.93), Ma (-0.30) and Bd (0.93) (Figure 2). This effect is expected since higher PR values are associated with worse soil structural conditions, and consequently, lower TP, Ma and higher Bd.
In Theodoro28 it was emphasized that the high value of soil resistance to penetration is directly linked to its compression, with this, negatively interfering in the growth and development of the root system of crops.
The attributes TP, AGRI and aggregates > 1mm were removed from the PCA because they are used to calculate variables derived from other ones.
For the 2020 data, the principal component analysis explained 65.84% of the data variance, whose value is close to the recommended value for using this type of analysis, at least 70%. For the use of this analysis model, this in several areas of knowledge, the percentage of components used in proportion to the total variance will have to correspond to 70% or more (Table 3). However, it is possible to find in the literature works with soil physical attributes with variances of 59.62% as values found by SOUZA29.
In the principal component 1 (PC1) the attributes that most explained the variance between treatments were tussock population with 37.10% of variance and negative correlation with PC1 (-0.80) and Micro with 37% and positive correlation with PC1(0.80).
The positive and negative correlations indicate inversely proportional trends between the two attributes, that is, a higher tussock population resulted in a lower amount of micropores in the soil. The higher tussock population is related to the greater contribution of organic matter to the soil and, therefore, a greater amount of macropores in the soil structure, since SOM serves as a substrate for microorganisms that act in the decomposition of the same, generate products such as organic compounds (microbial polysaccharides) in which, in association with fungal roots and hyphae, bring greater stability of macroaggregates18.
When analyzing the contribution of the treatments, the ones that most explained the variance of the data were, in descending order, Mavuno, Sabiá and Zuri grass. (Table 3) By relating the attributes to the treatments with the highest variance, it was possible to observe that the tussock population was more representative in the areas with Zuri and Mavuno grass, while the microporosity in the area with Sabiá grass (Figure 3-A).
This result demonstrates the potential of Mavuno and Zuri grasses to form larger amounts of tussock population than other forage plants. And this tends to improve the development of the plants, because the greater the tussock population tends improve greater the stability, aggregation and aeration of the soil, promoting a better physical environment for the development of the roots.
Table 3 – Correlation (C) and explained variance (EV) data in principal component 1 (PC 1) and 2 (PC 2) between soil attributes and ranking, based on EV, for forage selection in PC1 and 2 evaluated in PC end of the 2020 and 2021 off-season.
|
2020 |
||||||
|
PC 1 |
PC 2 |
|||||
|
Soil atributes |
R |
EV (%) |
R |
EV (%) |
||
|
Tuss |
-0,80 |
37,10 |
0,17 |
1,95 |
||
|
Sm |
0,22 |
2,99 |
-0,74 |
36,75 |
||
|
Micro |
0,80 |
37,00 |
0,48 |
15,33 |
||
|
Macro |
-0,38 |
8,56 |
-0,58 |
22,06 |
||
|
Bd |
-0,50 |
14,42 |
0,60 |
23,89 |
||
|
Forages |
PC 1 |
Ranking |
PC 2 |
Ranking |
||
|
Brauna |
1,23 |
7 |
23,66 |
2 |
||
|
Paiaguás |
0,67 |
9 |
30,74 |
1 |
||
|
Cayana |
3,74 |
4 |
0,34 |
9 |
||
|
Ipypora |
1,99 |
5 |
0,003 |
11 |
||
|
Mavuno |
42,95 |
1 |
4,58 |
5 |
||
|
Mulato |
0,79 |
8 |
1,05 |
8 |
||
|
Sabia |
32,10 |
2 |
0,04 |
10 |
||
|
Paredão |
0,02 |
11 |
1,26 |
7 |
||
|
Quenia |
1,47 |
6 |
2,80 |
6 |
||
|
Tamani |
0,11 |
10 |
16,90 |
4 |
||
|
Zuri |
14,88 |
3 |
18,58 |
3 |
||
|
2021 |
||||||
|
PC 1 |
PC 2 |
|||||
|
Soil atributes |
R |
EV (%) |
R |
EV (%) |
||
|
Tuss |
-0,843 |
21,29 |
-0,147 |
1,17 |
||
|
RDM |
-0,648 |
12,58 |
-0,554 |
16,57 |
||
|
Sm |
0,514 |
7,91 |
-0,807 |
35,14 |
||
|
Micro |
-0,507 |
7,70 |
-0,473 |
12,05 |
||
|
Macro |
0,572 |
9,79 |
0,000 |
0,00 |
||
|
Bd |
-0,365 |
3,99 |
0,664 |
23,79 |
||
|
SOM |
0,661 |
13,09 |
0,087 |
0,413 |
||
|
MWD |
-0,527 |
8,30 |
-0,185 |
1,86 |
||
|
MWG |
0,033 |
0,03 |
-0,278 |
4,18 |
||
|
RDSS |
-0,714 |
15,26 |
0,298 |
4,79 |
||
|
Forages Grasses |
PC1 |
Ranking |
PC2 |
Ranking |
||
|
Brauna |
2,48 |
7 |
0,60 |
9 |
||
|
Paiaguás |
7,58 |
4 |
8,03 |
4 |
||
|
Cayana |
26,26 |
2 |
16,64 |
2 |
||
|
Ipypora |
1,49 |
9 |
0,04 |
11 |
||
|
Mavuno |
1,15 |
8 |
2,78 |
6 |
||
|
Mulato |
0,20 |
11 |
1,64 |
7 |
||
|
Sabia |
25,88 |
3 |
50,46 |
1 |
||
|
Paredão |
2,76 |
6 |
7,45 |
5 |
||
|
Quenia |
0,48 |
10 |
11,27 |
3 |
||
|
Tamani |
4,17 |
5 |
1,02 |
8 |
||
|
Zuri |
27,49 |
1 |
0,05 |
10 |
||
Tuss: tussock population; RDM: root dry mass; Sm: soil moisture; Micro: microporosity; Macro: macroporosity; Bd: bulk density; SOM: organic material; MWD: weighted mean diameter; MWG: geometric mean diameter; RDSS: rapid diagnosis of soil structure.
In principal component 2 (PC 2), soil moisture was the most significant variable, with 36.75% of variance (Table 3) and was higher in soil with Paiaguás and Tamani grass, and between the two, Paiaguás was the most important to explain the variance in CP2 with 30.74%. Thus, it was possible to observe the importance of using Paiaguás grass to maintain higher water content in the soil. And this is important for the establishment of the next crop that will take advantage of the water available in the soil.
For the 2021 data, the tussock population was also the attribute that most explains the variance with 21.29% in PC1 and correlation of -0.84, followed by the RDSS attributes with variance of 15.21% and correlation with PC1 of -0.71 and RDM with variance of 12.58% and correlation with PC1 of -0.64 (Table 3). And, it was possible to observe that the three attributes showed the same orientation in PC1, indicating that the amount of RDM and D.Touc are directly related and when they present higher values, they tend to promote better RDSS scores (Figure 3-B). Grass species help a lot in structuring the soil due to their high root volume, which contribute to the approximation of particles by the constant absorption of water in the soil, distribution of organic exudates that stimulate microbial activity in the soil and also the contribution of organic matter to the system6,30.

Figure 3 – Biplot graph of principal component analysis of root parameter and soil physical attributes under different forage species evaluated at the end of the 2020 (A) and 2021 (B) off-season in Rio Verde-GO. Tuss: tussock population; RDM: root dry mass; Sm: soil moisture; Micro: microporosity; Macro: macroporosity; Bd: bulk density; SOM: organic material; MWD: weighted mean diameter; MWG: geometric mean diameter; RDSS: rapid diagnosis of soil structure.
By relating the most significant attributes to the study environments, it was possible to observe that Tuss, RDM, RDSS were more significant in Zuri and Cayana grass (Figure 3), with Zuri being the most important among the others to explain the differences, in the year 2021, with a contribution of 27.49% with PC1. As previously mentioned by Silva5, the higher tussock population promotes a greater contribution of OM to the soil and when associated with RDM, it contributes to the increase of this OM and also contributes to better soil structuring, and among the species studied, Zuri grass was the species that most explained such behavior.
In PC2, soil moisture was also the variable that most explains the variance with 35.14% and correlation of -0.80 (Table 3). When relating to the treatments, the highest soil moisture was in the area with Sabiá grass, indicating the potential the cultivar maintains higher water content in the soil.
In general, including the two years of evaluation, the soil attribute that stood out the most were tussock population and soil moisture, which are important variables for evaluating the effect of different grasses on the soil physical characteristics. And the grass that most contributed to explain the main differences in the study was Zuri and Sabiá grass.
In view of the present study, we observed that the tussock population was related to soil moisture, such behavior may be due to the greater tussock population promoting greater mass of aerial part of the species and consequently greater SOM, in which there is greater protection of the soil against water loss by evaporation31.
This indicates the importance of including forages in agricultural production systems in the Cerrado, as forages generate benefits to the soil due to the large production of dry mass of aerial part and roots, promoting a better soil physical environment for root development, such as greater aeration and water content for the successor crop (summer crop). Finally, forages are important for intensive soil use systems with annual crops.
4 CONCLUSION
The Zuri and Sabiá grass species were the ones that most explained the best parameters of tussock population and soil moisture.
Many of the variables were more expressive in the environment with Zuri grass, indicating the potential of the species compared to the others, mainly in the second year of evaluation, where Zuri grass improved soil conditions, with higher weighted mean diameter of soil particles and better soil structuration by rapid diagnosis of soil structure, probably due to higher tussock population in the area with Zuri grass.
Acknowledgment
To the COMIGO Technological Center for providing the experimental areas and to the Postgraduate Program in Plant Production at the University of Rio Verde-GO for making the study possible. And, to Post-graduate department (PRPG/ UniRV) for financial support for the publication.
REFERENCES
- Tótola MR, Chaer GM. Microrganismos e processos microbiológicos como indicadores da qualidade dos solos. Tópicos Cienc Solo, Viçosa, MG. 2002;2:195-276.
- Carvalho LLC. Diagnóstico da qualidade do solo em dois sistemas tradicionais de uso e manejo: citros e mandioca [Dissertação]. Cruz das Almas (BA): Universidade Federal do Recôncavo da Bahia; 2008.
- Lisboa BB, Vargas LK, Silveira AO, Martins AF, Selbach PA. Indicadores microbianos de qualidade do solo em diferentes sistemas de manejo. Rev Bras Cienc Solo. 2012;36(1):45-55.
- Moreira GM. Qualidade do solo em sistemas de integração lavoura, pecuária e floresta em Sinop, MT [Dissertação]. Viçosa: Universidade Federal de Viçosa; 2014.
- Silva AR, Sales A, Veloso CAC. Atributos físicos e disponibilidade de carbono do solo em sistemas de integração Lavoura-Pecuária-Floresta (ILPF) Homogêneo e Santa Fé, no estado do Pará, Brasil. Agropec Téc. 2016;37(1):96-104.
- Salton JC, Tomazi M. Sistema Radicular de Plantas e Qualidade do Solo. 1. ed. Dourados (Brasil): Embrapa (Comunicado Técnico 198); 2014.
- Ferreira ACB, Bogiani JC, Sofiatti V, Lamas FM. Sistemas de cultivo de plantas de cobertura para a semeadura direta do algodoeiro. 1. ed. Campina Grande (Brasil): Embrapa (Comunicado Técnico 377); 2016.
- Mendonça VZ, Mello LMM, Andreotti M, Pereira FCBL, Lima RC, Valério Filho WV, Yano EH. Avaliação dos atributos físicos do solo em consórcio de forrageiras e milho em sucessão com soja em região de cerrados. Rev Bras Cienc Solo. 2013;37(1):251-259.
- Oliveira P, Kluthcouski J, Borghi E, Ceccon G, Castro GSA. In: Cordeiro L, Vilela L, Kluthcouski J, Marchão R. Atributos da Braquiária como Condicionador de Solos sob Integração Lavoura-Pecuária e Integração Lavoura-Pecuária-Floresta. Cap 18. Brasília (Brasil): Embrapa Cerrado; 2015. p. 333-354.
- Santos HG, Jacomine PKT, Anjos LHC, Oliveira VA, Lumbrelas JF, Coelho MR, Almeida JA, Araújo Filho JC, Oliveira JB, Cunha TJF. Sistema Brasileiro de Classificação de Solos. 5. ed. Brasília (Brasil): Embrapa Solos; 2018.
- Santos HG, Jacomine PKT, Anjos LHC, Oliveira VA, Lumbreras, JF, Coelho, MR, Almeida JA, Cunha TJF, Oliveira JB. Sistema brasileiro de classificação de solos. 3. ed. Brasília, DF: Embrapa; 2013.
- United States Department of Agriculture – USDA. Keys to Soil Taxonomy. 20nd ed. Washington, DC: Natural Resources Conservation Service; 2014.
- Rolim GS, Sentelhas PC, Barbieri V. Planilhas no ambiente EXCELTM para os cálculos de balanços hídricos: normal, sequencial, de cultura e de produtividade real e potencial. Rev Bras Agrometeorol. 1998;6(1):133-137.
- Teixeira PC, Donagemma GK, Fontana A, Teixeira WG. Manual de Métodos de Análise de Solos. 3. ed. Brasília (Brasil): Embrapa; 2017.
- Molin JP, Dias CTD, Carbonera L. Estudos com penetrometria: Novos equipamentos e amostragem correta. Rev Bras Eng Agríc Ambient. 2012;16(5):584-590.
- Sims JR, Haby VA. Simplified colorimetric determination of soil organic matter. Soil Sci. 1971;112(2):137-141.
- Kemper WD, Chepil WS. Methods of soil analysis. Madison (USA): American Society of Agronomy; 1965.
- Wendling B, Jucksch I, Mendonça ES, Neves JCL. Carbono orgânico e estabilidade de agregados de um Latossolo Vermelho sob diferentes manejos. Pesqa Agropec Bras. 2005;40:487-494.
- Ralisch R, Debiasi H, Franchini JC, Tomazi M, Hernani LC, Melo AS, Santi A, Martins ALS, Bona FD. Diagnóstico Rápido da Estrutura do Solo – DRES. Londrina (Brasil): Embrapa Soja; 2017.
- Johnson RA, Wichern DW. Applied multivariate statistical analysis. 5. ed. London (Reino Unido): Pearson; 2002.
- Hair JF, Anderson RE, Tatham RL, Black W. Análise multivariada de dados. Porto Alegre (Brasil): Bookman; 2005.
- Mingoti AS. Análise de dados através de métodos de estatística multivariada: uma abordagem aplicada. Belo Horizonte (Brasil): UFMG; 2005.
- Ferreira DF. Estatística multivariada. 1. ed. Lavras (Brasil): UFLA; 2008.
- Kaiser HF. The varimax criterion for analytic rotation in factor analysis. Psychometrika. 1958;23:178-200.
- Bartholomew DJ. Principal components analysis. Inter Encyclo Edu. 2010;2:374-377.
- Littell RC, Milliken GA, Stroup WW. SAS for mixed models. Second ed. Journal of Biopha. Stat. 2006;17:363-365.
- Wolfinger R. Covariance structure selection in general mixed models. Commun Stat Simul Comput. 1993;22:1079-1106.
- Theodoro GF, Golin HO, Silva MS, Rezende RP, Abreu VLS. Influência de sistemas de preparo na manutenção da palhada e resistência do solo à penetração. Rev Agric Neotrop. 2018;5(2):25-30.
- Souza HS, Filho AAT, Souza EC, Arriel DAA, Medeiros RA. Análise multivariada de atributos químicos e físicos do solo em sistema agroflorestal com teca. Rev Scient Agrar. 2018;19(1):87-93.
- Silva IF, Mielniczuk J. Avaliação do estado de agregação do solo afetado pelo uso agrícola. Rev Bras Cienc Solo. 1997;21:313-319.
- Donagemma GK, Freitas PLD, Balieiro FDC, Fontana A, Spera ST, Lumbreras JF, Bortolon L. Caracterização, potencial agrícola e perspectivas de manejo de solos leves no Brasil. Pesq Agropec Bras. 2016;51:1003-1020.
* Mestrando Programa de Pós-graduação em Produção Vegetal da Universidade de Rio Verde (UniRV), pós-graduação em produção vegetal pela Universidade de Rio Verde (UniRV)
† Mestrando Programa de Pós-graduação em Produção Vegetal da Universidade de Rio Verde (UniRV), pós-graduação em produção vegetal pela Universidade de Rio Verde (UniRV)
‡ Pesquisador na Cooperativa Agroindustrial dos Produtores Ruaris do Sudoeste Goiano, Centro de Pesquisa do Centro Tecnológico Comigo
§ Prof. Faculdade de Agronomia e Programa de Pós-graduação em Produção Vegetal da Universidade de Rio Verde (UniRV), pós-graduação em produção vegetal pela Universidade de Rio Verde (UniRV)
¶ Prof. Faculdade de Agronomia e Programa de Pós-graduação em Produção Vegetal da Universidade de Rio Verde (UniRV), pós-graduação em produção vegetal pela Universidade de Rio Verde (UniRV)
** Prof. Faculdade de Agronomia e Programa de Pós-graduação em Produção Vegetal da Universidade de Rio Verde (UniRV), pós-graduação em produção vegetal pela Universidade de Rio Verde (UniRV)