
Artigo original
DEMOGRAPHY AND ESTERASE POLYMORPHISM OF BRAZILIAN POPULATIONS OF ZAPRIONUS INDIANUS (DIPTERA: DROSOPHILIDAE) FROM THE BRAZILIAN CERRADO LOCALITIES
Demografia e polimorfismos esterásicos em populações brasileiras de Zaprionus indianus (Diptera: Drosophilidae) oriundas de localidades do Cerrado brasileiro
https://doi.org/10.18593/evid.30144
Recebido em 19 de abril de 2022 | Aceito em 11 de novembro de 2022
Jonathan de Oliveira Rios* Sávio Cunha Costa† Luís Gustavo da Conceição Galego‡
Abstract:
Zaprionus indianus (fig fly) is a drosophilid of African origin that was recorded in Brazilian territory in 1999, quickly dispersing throughout the country, causing impacts on fig culture, and becoming one of the dominant Drosophilidae species in the Cerrado biome. Due to the fact it is an invasive species and a potential pest in fruit cultivars, it is essential to monitor the variations in the populations of this species aiming to verify its genetic and demographic structure and possible impacts on the drosophilid community. The demography and the genetic data obtained from the Est3 polymorphism of fig fly have been evaluated in six populations of Brazilian Cerrado sampled during the dry season. Multivariate analyses of PCA, UPGMA and landscape genetics were performed. The results have indicated variation in the demography of the sampled populations, the presence of two alleles (Est31 and Est34) in all of them, and a higher isolation degree of the Guaíra (SP) population. Thus, the fig fly is a colonizer of the Brazilian Cerrado, and the polymorphisms of Est3 locus are an appropriate genetic marker to investigate the bioinvasion process.
Keywords: Isoenzymes. Fig fly. Exotic species. Cerrado.
Resumo:
Zaprionus indianus é um drosofilídeo de origem africana e os registros de sua presença em território brasileiro iniciaram-se em 1999, sendo que rapidamente se dispersou por todo o país, causou impactos na cultura do figo à época e tornou-se uma das espécies dominantes no bioma Cerrado. Por ser uma espécie invasora e praga potencial de cultivares, é fundamental o acompanhamento das variações nas populações dessa espécie para se verificar sua estruturação genética e demográfica e possíveis impactos nas comunidades de drosofilídeos. Para se avaliar essa estruturação, foram realizadas coletas dessa espécie em seis diferentes localidades do cerrado brasileiro durante a estação seca de 2017. Nas populações coletadas de Z. indianus foram avaliados dados demográficos e genéticos a partir da variação do polimorfismo do loco Est3 e realizadas análises multivariadas de PCA, UPGMA e genética de paisagem. Os resultados indicaram variação na demografia das populações amostradas e a presença de dois alelos (Est31 e Est34) em todas elas, bem como um maior grau de isolamento da população oriunda de Guaíra (SP). Conclui-se que Z indianus é importante colonizadora do Cerrado brasileiro e o polimorfismo do loco Est3 constitui bom marcador para se investigar o processo de bioinvasão.
Palavras-chave: Isoenzimas. Zaprionus. Espécie exótica. Cerrado.
@Autor correspondente: Pós-Doutor em Biociências (Unesp) e Doutor em Genética (Unesp). Professor Associado II na Universidade Federal do Triângulo Mineiro, Av. Randolfo Borges Júnior, 1400, Univerdecidade, Uberaba-MG, Brasil, CEP 38064-200; https://orcid.org/0000-0002-6081-2700; luis.galego@uftm.edu.br
1 INTRODUCTION
The Drosophilidae family has more than four thousand species described, of which 304 are recorded in Brazil1. The Zaprionus genus in Drosophilidae family consists of 44 species, predominantly African2-4, which include two subgenus: Anaprionus Okada 19905, characterized by species from the Eastern regions, and Zaprionus. This subgenus presents the Z. indianus species (fig fly), which has broaded global distribution, is a successful bioinvader and a pest species in different cultivars4,6-11.
Carlos Vilela6 was the first researcher to report the fig fly on the American continent in 1999 and observed this species in persimmons (Diospyroskaki, Ebenaceae) from Santa Isabel, the metropolitan region of São Paulo. The species dispersed rapidly throughout Brazil and in less than two years, it was detected in several states of the country and South America12-19, and it also fastly invaded Central and North America7,10,20.
The bioinvasion of the fig fly caused an impact on 50% of fig culture in Brazil4,6,8, and it recently was categorized as a potential Union quarantine pest11,21. In fact, the larvae of this species feed on more than 80 species of plants, and it is the most polyphagous drosophilid in the Afrotropical fauna4,6. The species co-occurred in fruit crops with Drosophila suzukii22, where they are considered pests of grapes in the USA23,24, guavas in Mexico25 and strawberries in southern Brazil22. The fig fly is yet considered a secondary pest in pomegranate (Punica granatum) in western Iran orchards26.
In Brazil, the species shows dominance in Cerrado environments, and it is the most abundant species in the rainy season, representing about 40% of the collected drosophilid specimens26-30. Invasive species can affect local ecological communities and species composition, and it may become possible pests in newly colonized areas31-34, which makes it essential to investigate aspects related to the biology and ecology of these organisms. Even if it is likely that varying seasonal humidity and thermal conditions might affect distribution as well as the resistance level to different climatic stressors in wild populations of the fig fly from different continents9, in Brazil, a higher frequency of this species was recorded in the spring and the summer4,35.
One of the ways to expand the knowledge about these bioinvaders is to identify the genetic structure of different populations aiming to evaluate the degree of isolation and gene flow among them as an indication of their movement along the geographical landscape. One tool for this purpose is the evaluation of genetic polymorphisms from the isoenzyme variation in populations36-40. These enzymes show different electrophoretic mobility patterns, which indicates polymorphisms that could differ between populations and species that inhabit different environments36-40. From enzymatic polymorphisms, it is possible to study genetic population structure, detect and calculate the endogamy coefficient and verify the gene flow, natural selection and genetic drift occurrence. It is also possible to measure the founder effect and to map possible migration routes of the analyzed populations39,40.
Studies involving enzymatic polymorphisms in Brazilian populations of the fig fly include the presence of four alleles for phosphoglucomutase, three alleles for hexokinase 2, two alleles for the dehydrogenase isocyanate15, and four alleles for esterase 3 (Est31, Est32, Est33, and Est34), and two for esterase 2 (Est2S and Est2F)17,40.
Despite its abundance in tropical communities, especially in the Cerrado, studies on the variation and genetic structuring of the fig fly in this Brazilian biome are still scarce. In this sense, this study aimed to investigate the genetic variation of Est3 locus in Brazilian populations from the Cerrado Biome and thus verify their degree of genetic structuring as a possible route of its dispersion in this area.
2 METHODS
2.1 BIOLOGICAL MATERIAL
The fig fly collections were performed in six urban areas localized in Brazilian Cerrado (Figure 1) – São José do Rio Preto (RP), Olímpia (O), Guaíra (G), Conceição das Alagoas (CA), Uberaba (U), and Cássia (C). These collections occurred through three traps in each locality with banana-yeast baits41, placed 1.70 m from the ground, about two meters apart, and kept there for three days. All collections were made from May to August 2017. Climate data (maximum and minimum temperature, average temperature, temperature range, and pluviosity) for this collection period were obtained on Weather Spark (https://pt.weatherspark.com/). All collections were carried out during the dry season (May to August).
The phytophysiognomy of collected areas varies from Cerrado-Atlantic Forest ecotones or cerradão (RP, G and O) to parks of savanna (CA, U and C), second of the Banco de Dados de Informações Ambientais (BDiA-IBGE, https://bdiaweb.ibge.gov.br/#/consulta/vegetacao). The Cerradão is characterized by dense and homogeneous areas and the parks of savanna where the occurrence of trees is concentrated in specific locations on the landscape42,43.
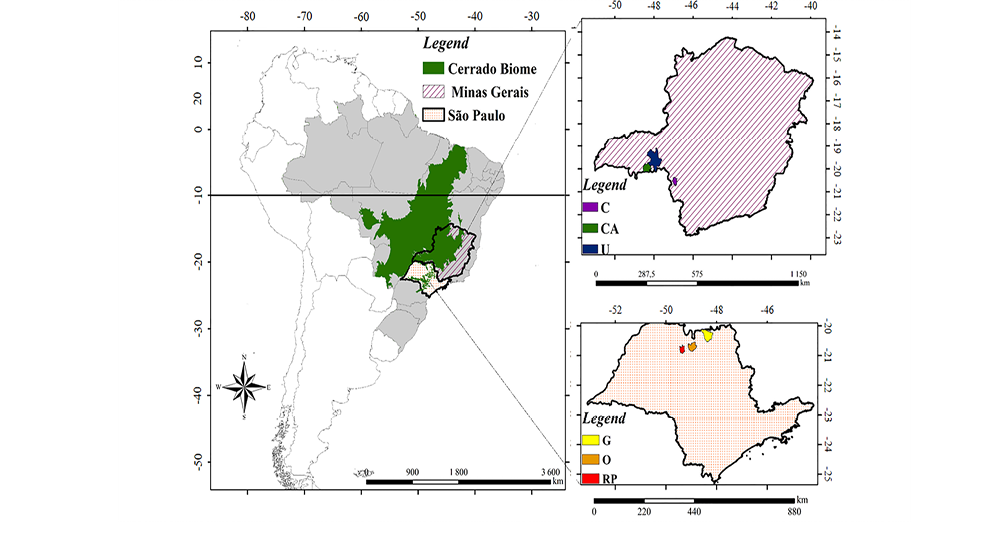
Figure 1 – Sampled areas of Brazilian Cerrado where Z. indianus was collected, including three localities in São Paulo (RP, O, and G) and three in Minas Gerais (CA, U, and C) states. RP: São José do Rio Preto; O: Olímpia; G: Guaíra; CA: Conceição das Alagoas; U: Uberaba; C: Cássia.
The climate conditions, temperature variation and pluviosity in each collection area are shown in Table 1. The weather conditions are similar in all localities with the rainy season occurring between October and March and the dry season between April and September. The sampled areas show warm and hot climates during all or part of the year, with temperatures varying between 13 and 33ºC, with an average of 23.8ºC, and annual rainfall between 1191.5 to 1343.6 mm.
Table 1 – Climate condition descriptions for each locality where Z. indianus was sampled, as well as its average, minimum and maximum temperatures, besides annual, minimum and maximum pluviosity. RP: São José do Rio Preto; O: Olímpia; G: Guaíra; CA: Conceição das Alagoas; U: Uberaba; C: Cássia.
|
Locality |
Climate conditions |
Temperature (ºC) |
Pluviosity (mm) |
|
U |
Wet rainy season (188.8mm per month) with almost overcast sky; dry season (35.2 mm per month) almost cloudless. The weather is warm during all year. |
23,1+1,2 (average) 15 (July) 30 (January) |
1343,6 (annual) 10 (July) 251 (January) |
|
C |
Rainy season (183.4mm per month) hushed and almost overcast; dry season (36.7 mm per month) almost cloudless. The weather is warm during all year. |
22,4+1,8 (average) 14 (June) 30 (October) |
1320,3 12 (July) 243 (January) |
|
G |
Rainy season (181.7mm per month) is hot, hushed and almost overcast; dry season (36.9 mm per month) is warm and almost cloudless. |
24,8+1,6 (average) 16 (June) 32 (October) |
1311,5 12 (July) 246 (January) |
|
RP |
Rainy season (159.7mm per month) is hot, hushed and almost overcast; dry season (38.9 mm per month) is warm and almost cloudless. |
23,3+2,0 (average) 13 (July) 33 (October) |
1191,5 14 (July) 231 (January) |
|
CA |
Rainy season (168.3mm per month) is hot, hushed and almost overcast; dry season (35.3 mm per month) is warm and almost cloudless. |
24,9+1,4 (average) 17 (July) 32 (October) |
1221,2 10 (July) 250 (January) |
|
O |
Rainy season (163.6mm per month) is hot, hushed and almost overcast; dry season (38.0 mm per month) is warm and almost cloudless. |
24,3+1,7 (average) 15 (June) 32 (November) |
1209,6 10 (July) 251 (January) |
2.2 ESTERASE POLYMORPHISMS CHARACTERIZATION
The esterase polymorphism detection was performed as described by Galego, Ceron e Carareto40. Each area was represented by a sample of 10 adult males and 10 females of the fig fly, which each individual was macerated in 20 µL of sample buffer (Tris-HCl 0.1 M; pH 8.8), applied 10 µL in a polyacrylamide gel (30.8%; C=5%), prepared with Tris-HCl buffer (1 M; pH 8.8). The electrophoresis was performed in Tris-Glicina buffer (0.1 M; pH 8.3) for three hours at 200 V.
The polyacrylamide gel with the samples was incubated in a phosphate buffer (0.1 M; pH 6.2) for 30 min. After that, the gel was stained, for more 30 min, using a phosphate buffer (0.1 M; pH 6.2), with 60 mg of alpha-naphthyl acetate plus 25 mg of beta-naphthyl acetate (diluted in 3 mL of acetone), plus 120 mg of Fast Blue RR (diluted in 5 mL of N-propanol). Finally, we analyzed the enzyme band for Est3 locus according to the pattern described by previous studies40,44.
2.3 STATISTICAL ANALYSIS
The demographic data were analyzed by z-test at 95% confidence interval (p<0,05), using MINITAB 19.1. The number of fig fly specimens collected were compared with that of other drosophilid specimens; also, the proportion of males and females was compared between the sampled populations. The data from collections were also used to calculate the the fig fly effective size by Ne=((4×Nm×Nf))/(Nm+Nf), where Nm is the number of collected males, and Nf is that for females. The climate data were normalized to plot comparison with demographic data.
The esterase polymorphisms data were analyzed using Genetix45-46. Genotypic frequencies were used to estimate allele frequencies and calculate the observed (Ho) and expected (He) heterozygosity, in addition to the number of alleles per locus (A) and the genetic distance of Nei47. The endogamy coefficient (F) was calculated from the Ho and He of both gene locations (Est2 and Est3), simultaneously using the formula F=(He-Ho)/He48-49.
The genetic data were used in the construction of dendrograms based on the hierarchical method of minimum variance with 10,000 permutations; demographic and genetic data for each of the subpopulations were sorted using a principal component analysis (PCA) using PAST 4.0350.
In addition to it, analysis of “Landscape Genetic Interpolation” (LGI) was performed using the Alleles in Space program51, as well as the estimation of barriers to gene flow, which was calculated using the MMDA (Monmonier Maximum Difference Algorithm)52-53.
3 RESULTS
The demographic data were shown in Table 2, and climate variables during de 2017 dry season are in Figure 2. The collections resulted in 877 individuals, 469 of the fig fly, and 408 of other drosophilids. The dominant species in all populations, except for RP and CA, was the fig fly; the greatest number was collected in O (142), and the fewest one was in RP (37). The species was relatively more abundant in O (67%) and G (70%) and the least abundant in RP (32%) and CA (35%). On the other hand, the number of the fig fly males and females collected in each locality ranged from 16 (RP) to 71 (O) and 10 (G) to 71 (O), respectively. The number of males was higher for G, and females in C and CA, but it was not different in all other populations. The proportion comparisons between the individual number of the fig fly to the total of Drosophilidae collected were statistically lower (p<0,001) for RP and CA and higher for the other populations. The effective size ranged from 30.91 (G) to 142 (O), and the lower proportion Ne/N was detected to G (70%).
Table 2 – Demographic data in each locality sampled, including the number of Drosophilidae specimens collected (Zaprionus indianus and others), their relative abundance (in brackets), the The fig fly male and female proportion (m/f), the effective size (Ne), and the total number of collected individuals (T) of fig fly populations and their ratio of the total specimens collected (Ne/T). RP: São José do Rio Preto; O: Olímpia; G: Guaíra; CA: Conceição das Alagoas; U: Uberaba; C: Cássia. *p<0.05; ***p<0.001.
|
Localities |
Z. indianus |
Other |
Total |
|||||
|
Males (m) |
Females (f) |
T |
m/f |
Ne |
Ne/T |
|||
|
U |
51 (54%) |
43 (46%) |
94 (60%) |
1.2 |
93.3 |
0.99 |
63 (40%) |
157 (100%) |
|
C |
26 (29%) |
65 (71%) |
91*** (59%) |
0.4 |
74.3 |
0.82 |
64 (41%) |
155 (100%) |
|
G |
34 (77%) |
10 (23%) |
44** (70%) |
3.4 |
30.9 |
0.70 |
19 (30%) |
63 (100%) |
|
RP |
16 (43%) |
21 (57%) |
37 (32%) |
0.8 |
36.3 |
0.98 |
78 (68%) |
115 (100%) |
|
CA |
21 (34%) |
40 (64%) |
61* (35%) |
0.5 |
55.1 |
0.90 |
113 (65%) |
174 (100%) |
|
O |
71 (50%) |
71 (50%) |
142 (67%) |
1.0 |
142.0 |
1.00 |
71 (33%) |
213 (100%) |
|
Total |
219 |
250 |
469 |
0.9 |
466.9 |
0.99 |
408 |
877 |
The highest individual number of fig flies was sampled in O (142), as shown in Table 2, where also was recorded high temperature range (11,3+1.3ºC) and average temperature (22.8+1.5ºC), and pluviosity (53.1+34.8 mm) during the dry season of 2017 (Figure 2). In CA and G were recorded the highest average (23.7+1.3ºC and 23.5+1.5ºC) and maximum temperatures – maxT (29.3+1.0ºC and 29.5+1.2ºC), and pluviosity (53.7+43.5 mm and 53.8+40.5 mm), as well as in U (53.8+44.4 mm). CA also recorded the greatest minimum temperature – minT (19.0+1.7ºC) and RP, the highest temperature range (11.7+1.7ºC). On the other hand, C showed the lowest maxT (27.0+1.3ºC), temperature average (21.0+1.7ºC) and pluviosity (52.2+38.8 mm), while the lowest minT and temperature range were detected, respectively, in RP (16.0+2.0ºC) and U (10.3+0.8ºC).
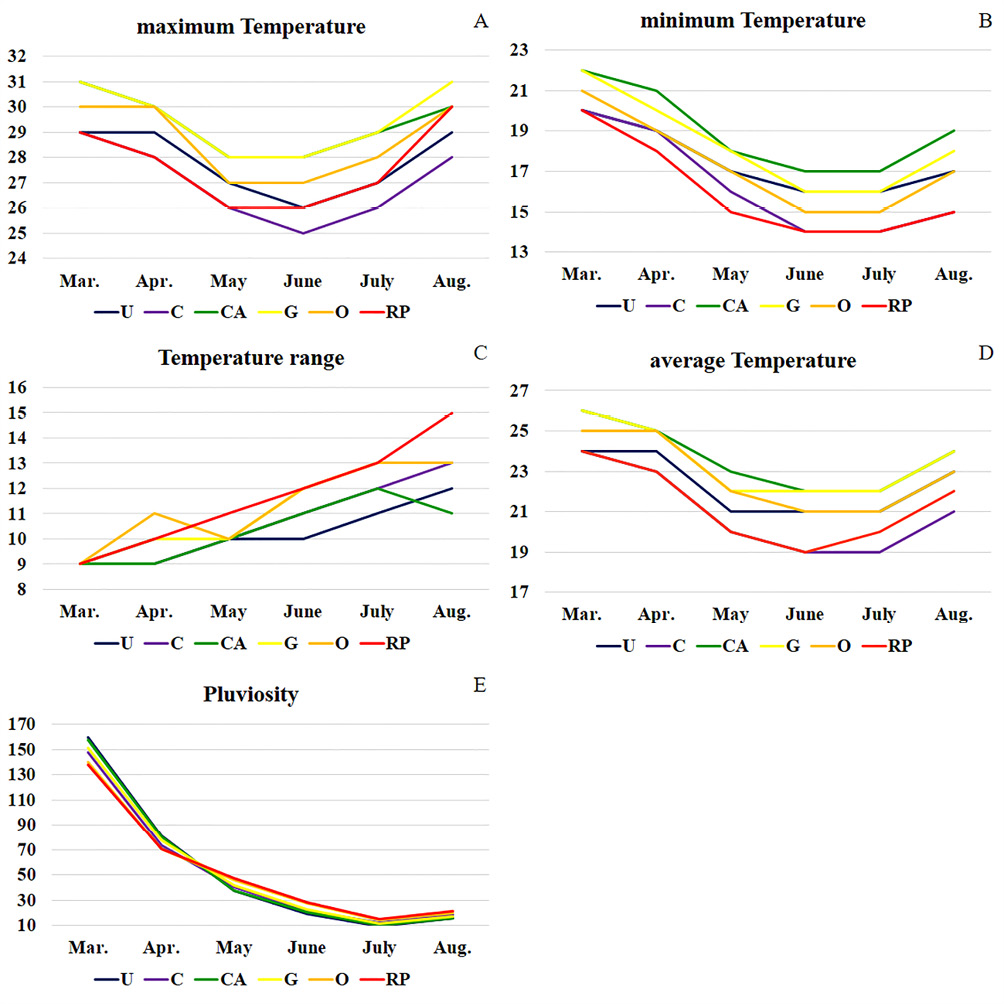
Figure 2 – Climate data variation for the sampled areas during the colections (dry season of 2017). (A) maximum temperature (maxT, in ºC); (B) minimum temperature (minT, in ºC); (C) temperature range (maxT-minT, in ºC); (D) average temperature, in ºC; (E) pluviosity, in mm. RP: São José do Rio Preto; O: Olímpia; G: Guaíra; CA: Conceição das Alagoas; U: Uberaba; C: Cássia
Differences in Est3 alleles in the fig fly populations were also detected (Table 3). The Est31 and Est34 alleles were detected in all populations, while the Est32 were not found in two (G and RP), and Est33 was not found in RP population. The Est31 and Est34 alleles were the most frequent in three (CA: 0.45; C: 0.36; and RP: 0.61) of the six sampled populations, while Est33 was the most frequent in two of them (U: 0.37; and G: 0.53). Table 3 shows that the endogamy coefficient varied from 0.10 (C) to 0.38 (U). The genetic distance (Table 4), on the other hand, indicates that the greater genetic distance was recorded in G population when compared to the other ones (0.069+0.028), even when considering geographic locations closer to this, such as is the case of O (0.114), far by 77 km, and RP (0.093), distant by 123 km, while the C, the lowest (0.030+0.014), even with RP (0.016), about 257 km far from C.
Table 3 – Allele frequencies of Est3 locus in Brazilian Cerrado populations of Z. indianus and observed (Ho) and expected (He) heterozygosities. n: sample size; A: number of alleles; F: endogamy coefficient; SD: standard deviation. RP: São José do Rio Preto; O: Olímpia; G: Guaíra; CA: Conceição das Alagoas; U: Uberaba; C: Cássia.
|
C |
U |
CA |
G |
O |
RP |
Average+SD |
|
|
(n) |
18 |
16 |
20 |
16 |
16 |
13 |
|
|
Est31 |
0.36 |
0.25 |
0.45 |
0.09 |
0.66 |
0.61 |
0.40+0.17 |
|
Est32 |
0.17 |
0.29 |
0.12 |
0.00 |
0.22 |
0.00 |
0.13+0.09 |
|
Est33 |
0.08 |
0.37 |
0.20 |
0.53 |
0.06 |
0.00 |
0.21+0.16 |
|
Est34 |
0.39 |
0.09 |
0.23 |
0.38 |
0.06 |
0.39 |
0.26+0.13 |
|
Ho |
0.61 |
0.44 |
0.55 |
0.44 |
0.39 |
0.31 |
0.42+0.11 |
|
He |
0.68 |
0.71 |
0.70 |
0.57 |
0.51 |
0.47 |
0.61+0.09 |
|
A |
4 |
4 |
4 |
3 |
4 |
2 |
3.5+0.67 |
|
F |
0.10 |
0.38 |
0.21 |
0.23 |
0.23 |
0.34 |
0.31 |
Table 4 – Geographic (diagonal above), in km, and Nei34 genetic (diagonal below) distances for populations of Z. indianus from Brazilian Cerrado. RP: São José do Rio Preto; O: Olímpia; G: Guaíra; CA: Conceição das Alagoas; U: Uberaba; C: Cássia.
|
C |
U |
CA |
G |
O |
RP |
|
|
C |
-- |
141.61 |
169.47 |
148.00 |
208.16 |
257.10 |
|
U |
0.035 |
-- |
50.29 |
75.17 |
149.81 |
191.20 |
|
CA |
0.009 |
0.019 |
-- |
45.26 |
106.06 |
143.34 |
|
G |
0.053 |
0.036 |
0.047 |
-- |
77.56 |
123.53 |
|
O |
0.035 |
0.045 |
0.016 |
0.114 |
-- |
49.12 |
|
RP |
0.016 |
0.074 |
0.017 |
0.093 |
0.026 |
-- |
The Principal Component Analysis (Figure 3A) and UPGMA analysis (Figure 3B) indicated more genetic differentiation of G population concerning the others, which they were more similar. C, CA, and U populations were more closely related each other, while RP and O as it once were. Including genetic data for Est3 locus from O and RP populations collected in 200426 in PCA and UPGMA, the analysis resulted in a cluster with O (2004), C, CA, and U; RP (2004) furthermore, was grouped with RP and O. Finally, in LGI analysis (Figure 4A), peaks indicate more significant genetic differentiation of the population, while valleys less divergence than others. In this way, G showed the greatest genetic variation from the others, as well as the PCA and UPGMA results. This finding is reinforced by the MMDA that showed a barrier to gene flow isolating the G population from the others (Figure 4B).
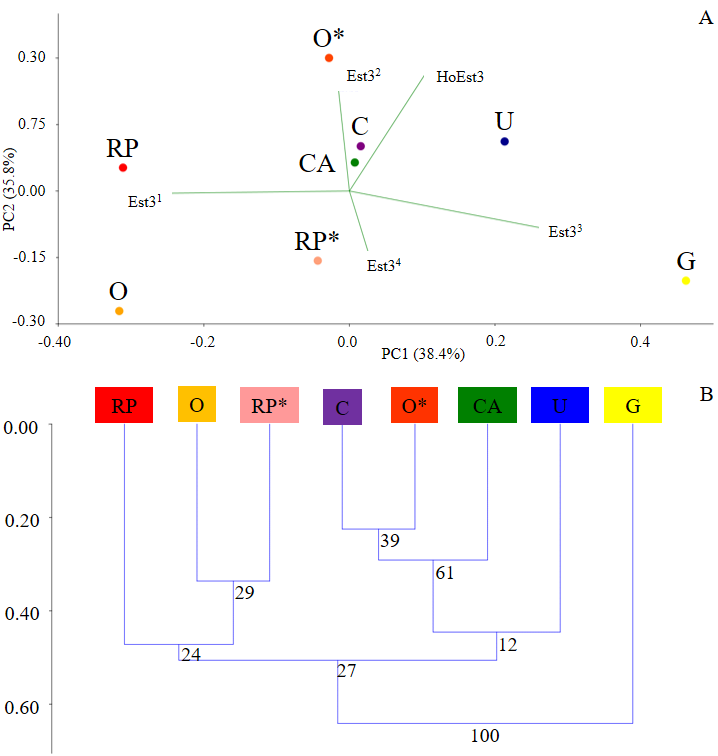
Figure 3 – Principal Component Analysis (A) and UPGMA (B) for genetic data of Est3 locus from Cerrado populations of Z. indianus. O* and RP* data have been obtained from collections carried out in 200426. RP: São José do Rio Preto; O: Olímpia; G: Guaíra; CA: Conceição das Alagoas; U: Uberaba; C: Cássia.
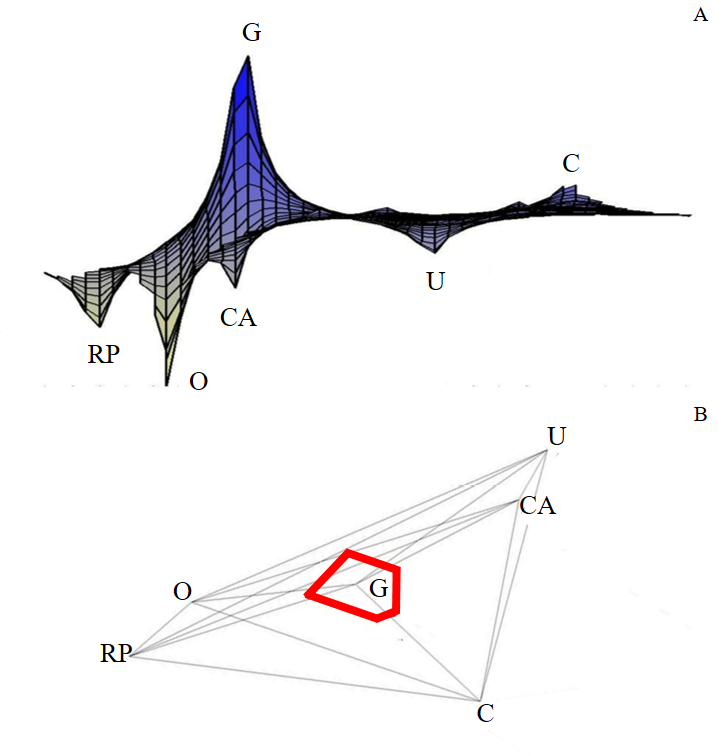
Figura 4 – (A) Landscape Genetic Interpolation (LGI) and (B) Monmonier Maximum Difference Algorithm (MMDA) for the genetic data related to Est3 locus polymorphism from Cerrado populations of Z. indianus. RP: São José do Rio Preto; O: Olímpia; G: Guaíra; CA: Conceição das Alagoas; U: Uberaba; C: Cássia.
4 DISCUSSION
Exotic species are found in all assemblages of the Drosophilidae family and their relative abundance depends on factors according to the vegetation type, the season of the year and disturbance degree34. The exotic species Z. indianus is collected in all Brazilian biomes, and it is abundant (over 35% of collected specimens) in the rainy season on open biomes, as the case of Caatinga54 and Cerrado55-58, and it is less common (under 15% of collected specimens) in the Atlantic forest, where the abundance of this species does not present a uniform seasonal fluctuation pattern concerning rainfall along their distribution range in the biome59. In the southern part of the Atlantic forest, on the other hand, the fig fly is more abundantly recorded in the rainy season60-61, however, in northeast part of this biome, the species is more abundant in the dry season,59 probably due to temperature variation, which is comparatively low and varies more broadly in the southern Atlantic Forest62.
Populations of the fig fly from native sites in Asia63 and Africa64 show the same pattern of the Brazilian’s Cerrado ones, where the species is more abundant during the rainy season. Meanwhile, in invaded areas in Asia, as the case of Indian populations, fig flies are also more abundant in the dry seasons65-66. Furthermore, the Brazilian populations of fig fly are very common in natural areas where the environmental conditions are similar to those from original region in Africa56,57, as is the case of Brazilian Cerrado. In this biome, it is the dominant species from several locations, mainly in open vegetation and during the wet season55,56.
Indeed, this species was the most frequent in almost all sampled localities, except on RP and CA. The fig fly shows a large niches distribution in the Cerrado and it can explore environments with different climate conditions, which could explain its higher abundance in this biome27,30,56. The species shows low frequency during the dry season especially when the rains are extremely scarce27, what happened to RP and CA populations where the pluviosity was the lowest during the dry season. On the other hand, the high temperatures are adaptative to the fig fly56,58,65-67, what would explain the highest abundance of this species in G and O.
In this work, only one collection of the fig fly was performed in each locality, which limits the discussions of our results about seasonality. However, the climate conditions evaluated during the collection period allowed us to discuss some aspects of the species abundance in these areas. The fig fly is able to develop when raised from 14 to 32ºC, and showed a very low survival rate when raised at 13ºC68. There is total lethality in the pupal stage when it is raised at 12ºC68, indicating that the species is more sensitive to cold, which would probably explain the fact that this fly is restricted to tropical and subtropical climates62. It shows higher frequencies during seasons with high temperatures, especially during the summer69. Variation in reproductive and cold tolerance physiology may enable or limit the geographical expansion of the fig fly to cooler localities70.
The fig fly expansion from Africa was studied from different genetic markers. The mitochondrial DNA (mtDNA) have been extensivly used with this goal, as is the case of the haplotype distribution of COI and COII genes71-74. These studies indicated the species has undergone two independent radiations from its origin in Africa: the oldest to the East (Madagascar, Middle East and India) and the most recent to the West (Americas and Madeira)71-72. Thus, all fig fly populations from America studied using sequences from mtDNA revealed lack of population structure and low genetic diversity, probably due to the population bottlenecks during the initial phase of the invasion73-74. In Mexican73 and Argentinan74 populations were detected haplotypes shared with Brazilian ones that would indicate the Atlantic coast of the Sao Paulo area in Brazil as the unique recipient of the invasion in South America and determining that dispersion in the American continent must have been northward from that point4,35-36.
The esterase polymorphism is another genetic marker used to investigate the fig fly bioinvasion in Brazil36,40,44. The high frequency of Est31 allele in almost all sampled populations of this species here had been detected yet in other Brazilian populations investigated to this marker before 200736,40; however, this frequency had been lower in other populations collected in 200217, including those from former African populations. The data of our study suggest a possible founder effect in sampled populations that they were possibly originated from propagules with a high frequency of Est31. This common allele would tend to improve the frequency by genetic drift, in addition to the gene flow that could have transferred alleles between populations. Indeed, the Est31 allele had not been detected in the fig fly population from Brasília in 200217, but it was in 200436. Sampled populations in 2004 from RP and O have recorded high frequencies of Est31 allele (0.34 and 0.35, respectively); more than ten years later, these frequencies have improved to 0.61 and 0.66, which could have been a result of genetic drift.
These dynamics in the variation of Est3 allele frequencies throughout the colonization history of the fig fly in Brazil indicate that this locus is an appropriate genetic marker for evolutionary studies since it is possible to detect variations on its frequencies over time. The Est3 heterozygosity indicated that populations have different genetic structures, indicating gene pools with higher (C and CA) and lower (O and RP) variation, and the data obtained here indicate relative isolation of the G populations. This genetic landscape is reinforced by the PCA ordination, the UPGMA clustering, and the genetic barriers estimated by the MMDA, which would indicate the isolation of the G population from the others. This scenario is compatible with that proposed by Galego and Carareto36, where fig fly dispersion along the Brazilian territory occurred through two main highways: Transbrasiliana (BR153) and Fernão Dias (BR116). Thus, the other populations sampled could be connected via BR153 and junctions, and G would receive less gene flow from individuals of the dispersion in this highway, becoming more differentiated.
Invasive populations of the fig fly from Argentina showed genetic variation for phenotypic plasticity in evolutionary and ecological traits, indicating the existence of heterogeneity between populations75. This could be a critical factor in the ability of populations to explore new habitats, pattern also reproduced in Est3 locus variation for the fig fly populations from Cerrado. Besides that, the genome sequence data and parameter estimates from thermal performance curves suggest the species has the broadest thermal niche of measured species of Zapionus genus investigated. That performance did not differ between invasive and native populations. These results illustrate how aspects of genetic diversity in invasive species could have helped the fig fly’s expansion range76 that include the Brazilian Cerrado invasion.
5 CONCLUSION
The fig fly is an efficient colonizer and has a wide distribution in the Cerrado Biome; the allele variation of Est3 locus could offer valuable information about the adaptation and evolution of this species. Besides that, the Brazilian Cerrado colonization shows variation in genetic polymorphisms and demography of populations that invaded differents Cerrado’s phytodomains, which could have been a biological response to selective pressures exerted by biotic and abiotic factors present in them.
ACKNOWLEDGEMENTS
This work was developed with support from the National Council for Scientific and Technological Development (Conselho Nacional de Desenvolvimento Científico e Tecnológico, CNPq) and the Minas Gerais Research Foundation (Fundação de Amparo à Pesquisa da Minas Gerais, FAPEMIG).
REFERENCES
- Bächli G. TaxoDros: The Database on Taxonomy of Drosophilidae [Internet]. 2022 [cited 2022 Mar 23]. Available from: https://www.taxodros.uzh.ch/.
- Chassagnard MT. Les espèces africaines du sous-genre Zaprionus s. str À six bandes thoraciques (Diptera: Drosophilidae). Ann Société Entomol Fr. 1996;32(1):59-65.
- Chassagnard MT, Tsacas L. Le sous-genre Zaprionus s.str. Définition de groupes d’espèces et révision du sous-groupe vittiger (Diptera: Drosophilidae). Annales de la Société Entomologique de France. 1993;29:73-94.
- Commar LS, Galego LGC, Ceron CR, Carareto CMA. Taxonomic and evolutionary analysis of Zaprionus indianus and its colonization of Palearctic and Neotropical regions. Genet Mol Biol. 2012;35(2):395-406.
- Okada T. New Taxonomic Changes in the Family Drosophilidae (Diptera). Journal of Applied Entomology and Zoology. 1990;58:154.
- Vilela RC. Is Zaprionus indianus Gupta, 1970 (Diptera, Drosophilidae) currently colonizing the Neotropical Region? Drosoph Inf Serv. 1999;82:37-9.
- Van der Linde K, Birdsley JS, Steck GJ, Houle D, Hibbard K, Alonso LM. First Records of Zaprionus indianus (Diptera: Drosophilidae), a Pest Species on Commercial Fruits From Panama and the United States of America. Florida Entomol. 2006;89(3):402-404.
- Vilela CR, Teixeira EP, Stein CP. Mosca-africana-do-figo, Zaprionus indianus (Diptera: Drosophilidae). In: Fealq, editor. Pragas introduzidas no Brasil: 1st ed. Ribeirão Preto: Holos; 2001. p. 48-52.
- Tidon R, Leite DF, Leão BFD. Impact of the colonisation of Zaprionus indianus (Diptera, Drosophilidae) in different ecosystems of the neotropical region: 2 years after the invasion. Biol Conserv. 2003;112(3):299-305.
- Renkena JM, Miller M, Fraser H, Legaré JPH, Hallett RH. First records of Zaprionus indianus Gupta (Diptera: Drosophilidae) from commercial fruit fields in Ontario and Quebec, Canada. Journal of the Entomological Society of Ontario. 2013;144:125-130.
- Bragard C, Baptista P, Chatzivassiliou E, Di Serio F, Gonthier P, Miret JAJ, Justesen AF, Magnusson CS, Milonas P, Navas-Cortes JA, Parnell S, Potting R, Reignault PL, Stefani E, Thulke HH, Werf WV, Civera AV, Yuen J, Zappala L, Gregoire JC, Malumphy C, Kertesz V, Maiorano A, MacLeod A. Pest categorisation of Zaprionus indianus. EFSA Journal. 2022;20(3):7144.
- Toni DC, Hofmann PRP, Valente VLS. First record of Zaprionus indianus (Diptera, Drosophilidae) in the State of Santa Catarina, Brazil. Biotemas. 2001;14:71-85.
- Castro FL, Valente VL. Zaprionus indianus is invading Drosophilid communities in the southern Brazilian city of Porto Alegre. Dros Inf Serv. 2001;84:15-7.
- Loh R, Bitner-Mathé BC. Variability of wing size and shape in three populations of a recent Brazilian invader, Zaprionus indianus (Diptera: Drosophilidae), from different habitats. Genetica. 2005;125(2–3):271-81.
- Goñi B, Fresia P, Calviño M, Ferreiro MJ, Valente VLS, Silva LD. First record of Zaprionus indianus Gupta, 1970 (Diptera, Drosophilidae) in southern localities of Uruguay. Drosoph Inf Serv. 2001;84:61-65.
- David JR, Araripe LO, Bitner-Mathé BC, Capy P, Goñi B, Klaczko LB, Legout H, Martins MB, Vouidibio J, Yassin A, Moreteau B. Quantitative trait analysis and geographic variability of natural populations of Zaprionus indianus, a recent invader in Brazil. Heredity. 2006;96(1):53-62.
- Machado TM, Solé-Cava AM, David JR, Bitner-Mathé BC. Allozyme variability in an invasive drosophilid, Zaprionus indianus (Diptera: Drosophilidae): Comparison of a recently introduced Brazilian population with Old World populations. Ann la Soc Entomol Fr. 2005;41(1):7-13.
- Fernandes DRR, Araújo EL. Ocorrência de Zaprionus indianus Gupta (Diptera: Drosophilidae) em frutos de Juazeiro Ziziphus joazeiro mart. (Rhamnaceae) no estado do rio grande do norte1. Rev Bras Frutic. 2011;33(4):1356-1358.
- Vasconcelos AS, Azevedo TS, Santos RS. Primeiro registro de Zaprionus indianus Gupta (Diptera: Drosophilidae) no Estado do Acre. EntomoBrasilis. 2017;10(1):60-63.
- Markow TA, Hanna G, Riesgo-Escovar JR, Tellez-Garcia AA; Richmond MP, Yepiz NON, Laclette MRL, Carpinteyro-Ponce J, Pfeiler E. Population genetics and recent colonization history of the invasive drosophilid Zaprionus indianus in Mexico and Central America. Biol. Invasions. 2014;16:2427-2434.
- Pfeiffer DG, Shrader ME, Wahls JC, Willbrand BN, Sandum I, van der Linde K, Laub CA, Mays RS, Day ER. African fig fly (Diptera: Drosophilidae): biology, expansion of geographic range, and its potential status as a soft fruit pest. Journal of Integrated Pest Management. 2019;10(1):1-8.
- Bernardi D, Andreazza F, Botton M, Baronio CA, Nava DE. Susceptibility and interactions of Drosophila suzukii and Zaprionus indianus (Diptera: Drosophilidae) in damaging strawberry. Neotropical Entomology. 2017;46:1-7.
- Van Timmeren S, Isaacs R. Drosophila suzukii in Michigan vineyards, and the first report of Zaprionus indianus from this region. Journal of Applied Entomology. 2014;138:519–527.
- Joshi NK, Biddinger DJ, Demchak K, Deppen A. First report of Zaprionus indianus (Diptera: Drosophilidae) in commercial fruits and vegetables in Pennsylvania. Journal of Insect Science. 2014;14:1-4.
- Lasa R, Tadeo E. Invasive drosophilid pests Drosophila suzukii and Zaprionus indianus (Diptera: Drosophilidae) in Veracruz. Mexico. Florida Entomologist. 2015;98:987-988.
- Tavakoli M, Sattari S, Hosseini-Chegeni A. Additional records of the African fig fly Zaprionus indianus Gupta, 1970 (Diptera: Drosophilidae) for western Iran supported by DNA barcoding. Journal of Animal Diversity. 2020;2(3):16-23.
- Mata RA, Tidon R. The relative roles of habitat heterogeneity and disturbance in drosophilid assemblages (Diptera, Drosophilidae) in the Cerrado. Insect Conservation and Diversity. 2013;6(6): 663-670.
- Chaves NB, Tidon R. Aspectos biogeográficos dos drosofilídeos (Insecta, Diptera) do bioma cerrado. In: Diniz IR, Marinho Filho J, Machado RB, Cavalcanti RB. Cerrado: conhecimento científico quantitativo como subsídio para ações de conservação. 1a ed. Brasília: Thesaurus; 2010.
- Cavalcanti FAGS, Ribeiro LB, Marins G, Tonelli GSSS, Bào SN, Yassin A, Tidon R. Geographic expansion of na invasive fly: first record Zaprionus tuberculatus (Diptera: Drosophilidae) in the Americas. Annals of Entomological Society of America. 2022;115(3):267-274.
- Mata RA, Valadão H, Tidon R. Spatial and temporal dynamics of drosophilid larval assemblages associated to fruits. Revista Brasileira de Entomologia. 2015;59:50-57.
- Galego LGC, Carareto CMA. Effects of intraspecific and interspecific pre-adult competition on the neotropical region colonizer fly Zaprionus indianus (Diptera: Drosophilidae). Bragantia. 2005;64:249-255.
- Skálová H, Jarošík V, Dvořáčková Š, Pyšek P. Effect of intra – and interspecific competition on the performance of native and invasive species of impatiens under varying levels of shade and moisture. PLoS One. 2013;8(5):e62842.
- Shaw B, Brain P, Wijnen H, Fountain MT. Reducing Drosophila suzukii emergence through inter-species competition. Pest Manag Sci. 2018;74(6):1466-1471.
- Kalra B, Parkash R. effects of saturation deficit on desiccation resistance and water balance in seasonal populations of the tropical drsosphilid Zaprionus indianus. Journal of Experimental Biology. 2016;219:3237-3245.
- Silva NM, Fantinel CC, Valente VLS, Valiati VH. Population Dynamics of the Invasive Species Zaprionus indianus (Gupta) (Diptera: Drosophilidae) in Communities of Drosophilids of Porto Alegre City, Southern of Brazil. Neotropical Entomology, 2005;34(3):363-374.
- Galego LGC, Carareto CMA. Scenario for the spreading of the invasive species Zaprionus indianus Gupta, 1970 (Diptera: Drosophilidae) throughout Brazil. Genetics and Molecular Biology. 2010;33:767-773.
- Araújo SB, Patricio GF, Simoni IC, Rivas EB, Fernandes MJB. Isoenzyme and molecular approach for authenticating and monitoring of animal cell lines. An Acad Bras Cienc. 2019;91(3):1-11.
- Bader JM. Measuring Genetic Variability in Natural Populations by Allozyme Electrophoresis. Proc 19th Work Assoc Biol Lab Educ. 1998;25-42.
- Marques LA, Renesto E. Genetic variability and evidence of founder effect in Hemiodus orthonops (Characiformes: Hemiodontidae) from the upper Paraná River basin, Brazil. Acta Sci – Biol Sci. 2017;39(1):53-8.
- Galego LGC, Ceron CR, Carareto CMA. Characterization of esterases in a Brazilian population of Zaprionus indianus (Diptera: Drosophilidae). Genetica. 2006;126(1-2):89-99.
- Tidon R, Sene FM. Trap that retains and keeps Drosophila alive. Drosoph Inf Serv. 1998;67(0):89.
- Ribeiro JF, Walter BMT. Fitofisionomias do bioma Cerrado. In: Sano SM, Almeida SP. Cerrado: ambiente e flora. Planaltina: EMBRAPA-CPAC, 1998. p. 89-166.
- Oliveira-Filho AT, Ratter JA. Vegetation Physiognomies and Woody Flora of the Cerrado Biome. In: Oliveira OS, Marquis RJ, editores. The Cerrados of Brazil: ecology and natural history of a neotropical savanna. New York: Columbia University Press; 2002. p. 91-120.
- Prata AP, Galego LGC. Variação genética em populações naturais e laboratoriais de Zaprionus indianus GUPTA 1970 (Diptera: Drosophilidae). Conexão Ciência. 2022;17(2):74-93.
- Peakall R, Smouse PE. GenAlEx 6: genetic analysis in Excel. Population genetic software for teaching and research. Mol Ecol Notes. 2006;6:288-295.
- Peakall R, Smouse PE. GenAlEx 6.5: genetic analysis in Excel. Population genetic software for teaching and research – an update. Bioinformatics. 2012;28:2537-2539.
- Nei M. Molecular Evolutionary Genetics. 1st ed. vol. 1. Columbia University Press; 1987. 514p.
- Hartl DL. Princípios de genética de população. 3a. ed. São Paulo: FUNPEC, 2008.
- Kumar S, Singh S, Singh AK. Persistence of heterozygosity owing to balancing selection at allozyme loci in laboratory populations of Drosophila ananassae. Genomics and Genetics. 2019;12:11-18.
- Hammer Ø, Harper DAT e Ryan PD. PAST: Paleontological Statistics Software Package for Education and Data Analysis. Palaeontologia Electronica. 2001;4:9. Available from: http://palaeo-electronica.org/2001_1/past/issue1_01.htm.
- Miller MP. Alleles In Space (AIS): Computer software for the joint analysis of interindividual spatial and genetic information. J Hered. 2005;96(6):722-4.
- Watson DF. Contouring: A guide to the analysis and dis-play of spatial data. New York: Pergamon Press; 1992. 321 pp.
- Brouns G, De Wulf A, Constales D. Delaunay triangulation algorithms useful for multibeam echosounding. J. Surv. Eng. 2003;129:79-84.
- Monte MA, Neves CHCB, Ferreira AF, Santos MFS, Quintas JIFP, Manetta GDA, Oliveira PV, Garcia ACL. Invasion and Spreading of Drosophila nasuta (Diptera, Drosophilidae) in the Caatinga Biome, Brazil. Neotropical Entomology. 2021;50:571-578.
- Ferreira LB, Tidon R. Colonizing potential of Drosophilidae (Insecta, Diptera) in environments with different grades of urbanization. Biodivers Conserv. 2005;14(8):1809-21.
- Mata RA, Tidon R, Côrte LG, Marco P, Diniz-Filho JAF. Invasive and flexible: niche shift in the drosophilid Zaprionus indianus (Insecta, Diptera). Biol Invasions. 2010;12:1231-1241.
- Yuzuki K, Tidon R. Identification key for drosophilid species (Diptera, Drosophilid) exotic to the Neotropical Region and occuring in Brazil. Revista Brasileira de Entomologia. 2020;64(1):e2019100.
- Chaves NB, Tidon R. Biogeographical aspects of drosophilids (Diptera, Drosophilidae) of the Brazilian savanna. Revista Brasileira de Entomologia. 2008;52(3):340-348.
- Coutinho-Silva RD, Montes MA, Oliveira GF, Carvalho-Neto FG, Rohde C, Garcia ACL. Effects of seasonality on drsophilids (Insect, Diptera) in the northern part of the Atlantic Forest, Brazil. Bulletin of Entomological Research. 2017.
- De Toni DC, Gottschalk MS, Cordeiro J, Hofmann PRP, Valente VLS. Study of the Drosophilidae (Diptera) communities on Atlantic Forest islands of Santa Catarina State, Brazil. Neotropical Entomology. 2007;36:356-375.
- Bizzo L, Gottschalk MS, De Toni DC, Hofmann PRP. Seasonal dynamics of a drosophilid (Diptera) assemblage and its potencial as bioindicator in open environments. Iheringia Série zoologia. 2010;100:185-191.
- Garcia ACL, Valiati VH, Gottschalk MS, Rohde C, Valente VLS. Two decades of colonization of the urban environment of Porto Alegre, southern Brazil, by Drosophila paulistorum (Diptera, Drosophilidae). Iheringia Série Zoologia. 2008;98: 329-338.
- Srinath BS, Shivanna N. Seasonal variation in natural populations of Drosophila in Dharwad, India. Journal of Entomology and Zoology Studies. 2014;2:35-41.
- Prigent SR, Le Gall P, Mbunda SW, Veuille M. Seasonal and altitudinal structure of drosophilid communities on Mt Oku (Cameroon volcanic line). Comptes Rendus Geoscience. 2015;345:316-326.
- Kalra B, Tamang MA, Parkash R. Cross-tolerance effects due to adult heat hardening, desiccation and starvation acclimation of tropical drosophilid-Zaprionus indianus. Comparative Biochemistry and Physiology. 2017;A177:65-73.
- Girish TN, Pradeep BE, Parkash R. Heat – and humidity-induced plastic changes in body lipids ans starvation resistance in the tropical fly Zaprionus indianus during wet and drys seasons. Journal of experimental Biology. 2018;221:jeb174482.
- Salvino MS, Rohde C, Verçosa CJ, Mendes JFC, Silva RDC, Oliveira GF. Elevada abundância de drosofilídeos e baixa riqueza de espécies, uma realidade da composição em ambiente cultivado de Pernambuco. Res Soc Dev. 2021;10(15):e249101522673.
- Karan D, Moreteau B, David JR. Growth temperature and reaction norms of morphometrical traits in a tropical drosophilid: Zaprionus indianus. Heredity. 1999;83:398-407.
- Araripe LO, Klaczko LB, Moreteau B, David JR. Male sterility thresohlds in a tropical cosmopolitan drosophilid, Zaprionus indianus. Journal of Thermal Biology. 2004;29:73-80.
- Lavagnino NJ, Fanara JJ, Mensch J. Comparison of overwintering survival and fertility of Zaprionus indianus (Diptera: Drosophilidae) flies from native and invade range. Journal of Thermal Biology. 2020;87:102470.
- Yassin A, Capy P, Madi-Ravazzi L, Ogereau D, David JR. DNA barcode discovers two cryptic species and two geographical radiations in the invasive drosophilid Zaprionus indianus. Molecular Ecology Resources. 2020;8:491-501.
- Yassin A, Borai F, Capy P, David JR, Elias E, Riad SA, Shalaby HG, Serour S, Abou-Youssef AY. Evolutionary Genetics of Zaprionus. II. Mitochondrial DNA and chromosomal variation of the invasive drosophilid Zaprionus indianus in Egypt. Mitochondrial DNA. 2009;20:34-40.
- Markow TA, Hanna G, Riesgo-Escovar JR, Tellez-Garcia AA, Richmond MP, Nazario-Yepiz NO, Laclette MRL, Carpinteyro-Ponce J, Pfeiler E. Population genetics and recent colonization history of the invasive drosophilid Zaprionus indianus in Mexico and Central America. Biol Invasions. 2014;16:2427-2434.
- Goya LF, Imberti M, Rodriguero MS, Fanara JJ, Risso G, Lavagnino NJ. Mitochondrial genetic diversity of the invasive drosophilid Zaprionus indianus (Diptera: Drosophilidae) in South America. Biological Invasions. 2020;22:3481-3486.
- Lavagnino NJ, Imberti M, Ortiz VE, Flaibani N, Fanara J. Contrasting levels of genotype by environment interaction for life history and morphological traits in invasive populations of Zaprionus indianus (Diptera: Drosophilidae). Insect Science. 2020;27(5):1090-1100.
- Comeault AA, Wang J, Tittes S, Isbell K, Ingley S, Hurlbert AH, Matute DR. Genetic diversity and thermal performance in invasive and native populations of African Fig Flies. Molecular Biology Evolution. 2020;37(7):1893-1906.
* Doutorando em Genética e Biologia Evolutiva, Universidade Estadual Paulista Júlio de Mesquita Filho, Instituto de Biociências, Letras e Ciências Exatas, Rua Cristóvão Colombo, 2265, Jardim Nazareth, São José do Rio Preto/SP, CEP 15054-000.
† Doutorando em Entomologia, Departamento de Biologia, Universidade de São Paulo, Av. Bandeirantes, 3900, Bairro Monte Alegre, Ribeirão Preto-SP, CEP 14040-901, Brasil.
‡ Pós-Doutor em Biociências (Unesp) e Doutor em Genética (Unesp). Professor Associado II na Universidade Federal do Triângulo Mineiro, Av. Randolfo Borges Júnior, 1400, Univerdecidade, Uberaba-MG, Brasil, CEP 38064-200.